|
|
|
|
|
|
|
The future of SQL monitoring
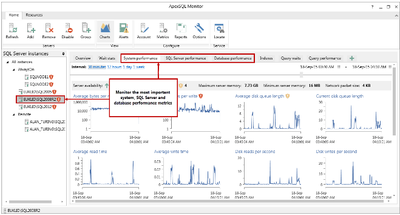
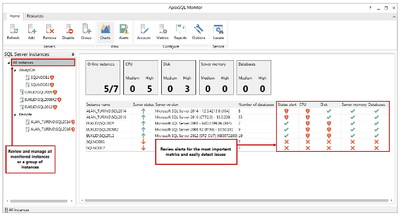
Monitor, detect, and solve SQL Server performance problems

Features
|
System requirements
Hardware requirements Quad-core 3.0 GHz CPU (the specification considers monitoring of 5 SQL Server instances with medium to high activity)
4 GB memory
30 GB disk space (for 7 days data retention policy - this is an average requirement based on real word use cases, but this could further vary depending on the monitoring instances state/activity)
SQL Server Microsoft SQL Server 2016, 2014, 2012, 2008, and 2005
OS Windows Vista/Server 2008 and above
Required Microsoft .NET Framework 4.5
Note
Central instance requires Microsoft SQL Server 2008 or greater
Native support for the x64 architecture
Microsoft SQL Server Express edition is not recommended for the central repository, due to the database size limitation
The additional requirements are described in the ApexSQL Monitor - Permissions and requirements knowledgebase article
| ApexSQL | Idera | Solarwinds | SQL Sentry | |
| Monitoring | ||||
| AlwaysOn Availability Groups |  |
|
|
|
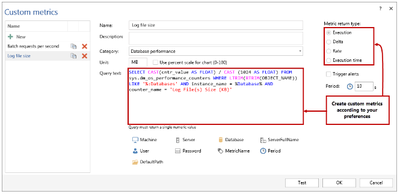
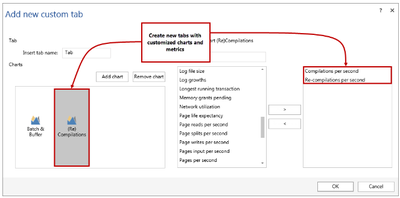
| Custom SQL metrics | |
|
|
|
| Custom system metrics | |
|
|
|
| Failover clusters | |
|
|
|
| Indexes | |
|
||
| SQL Agent status | |
|
|
|
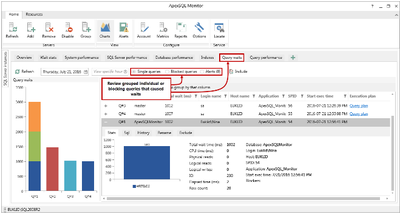
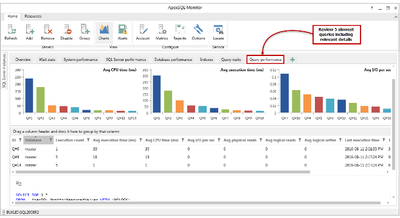
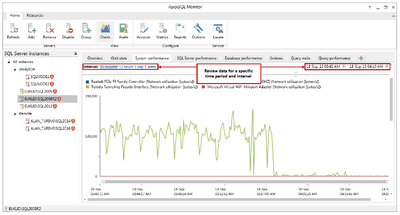
| Query performance | |
|
|
|
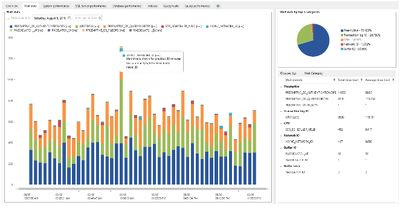
| Query waits | |
|
|
|
| VMware | 2017 R2 | |
|
|
| Hyper-V | 2017 R2 | |
|
|
| Alerting | ||||
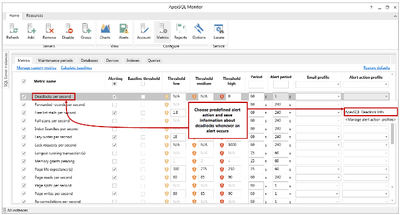
| Alert actions | |
|
|
|
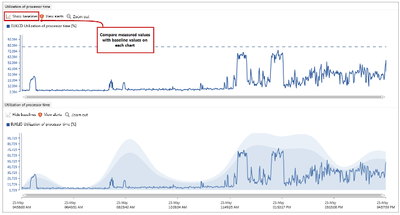
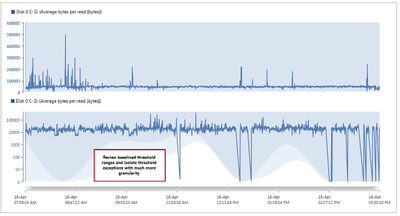
| Alert baselines | |
|
|
|
| SNMP traps | |
|
|
|
| Query level alerts | |
|
|
|
| Reporting | ||||
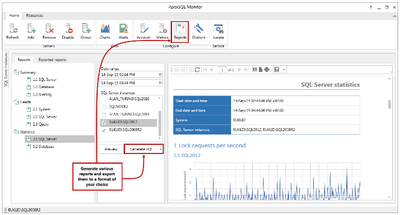
| Exporting to PDF, Excel | |
|
|
|
| Internal report viewer | |
|
|
|
| Report generation | |
|
|
|
| Scheduled reports | 2017 R2 | |
|
|
| Performance issues analysis | ||||
| Metric troubleshooting | |
|
|
|
| Tips | |
|
|
|
| Analysis | 2017 R2 | |
|
|
| Configuration | ||||
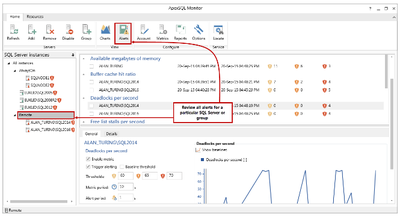
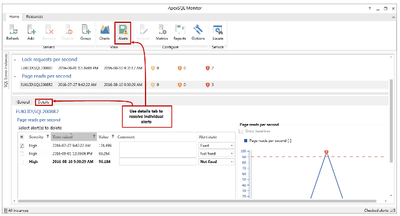
| Alerts | |
|
|
|
| Alert snoozing* | |
|
|
|
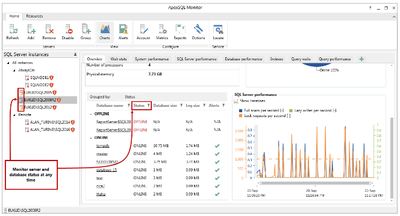
| Databases | |
|
||
| Devices | |
|
||
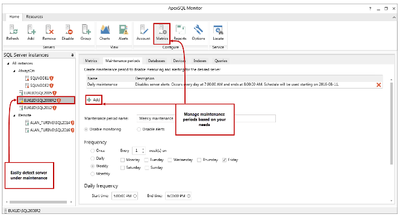
| Maintenance periods | |
|
|
|
| Web | ||||
| Web console | 2017 R1 | |
||
| Full web version | 2017 R1 | |
|
|
| Other | ||||
| Blocking detection | |
|
|
|
| Deadlock detection | |
|
|
|
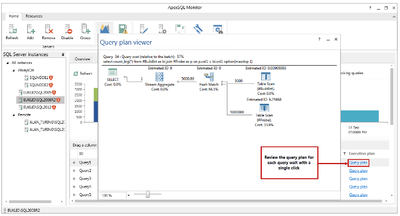
| Graphical query execution plans | |
|
|
|
| Repository purging | |
|
|
|
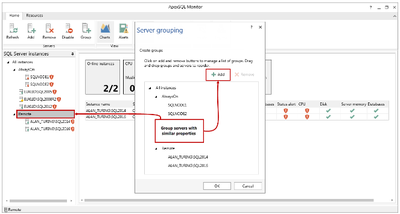
| Server grouping | |
|
|
|
| User profiles | |
|
|
|

© Copyright 2000-2025 COGITO SOFTWARE CO.,LTD. All rights reserved