Memory and Performance Profiling
Find Issues & Memory Leaks with Application Runtime Analysis & Performance Profiling

Performance & Memory Profiler
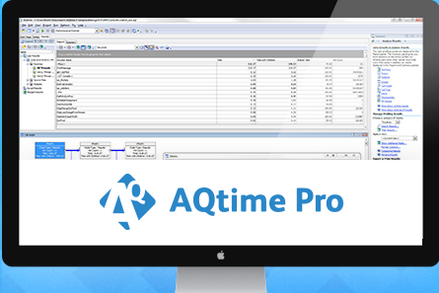
AQtime Pro is a software performance exploration suite to help developers track down memory profiling issues, CPU and other I/O bottlenecks, perform comprehensive code coverage analysis, and perform fault simulation. It includes profiling and coverage support for Java, Microsoft .NET profiling, C/C++, Delphi, JScript, VBScript, Silverlight, and other programming frameworks.
DevOps teams deploying .Net webservers can use AQtime's performance profilers to isolate performance issues and bottlenecks. Diving deeper with AQtime's tools ensures that problems are pinpointed quickly, so that environments are running at peak performance.
Improve Application Performance
AQtime offers multiple modes for application performance analysis. You can start with a quick performance inspection using the lightweight Sampling profiler and then drill deeper into the hot spots using the more accurate Performance profiler.
· Profile what you need
· Insightful performance reports
· Thread-Aware measurements
· Comparable profiling data


Optimize Memory Usage
AQtime Memory Monitor shows your application’s memory and resource allocations in real time to help you detect excessive memory and resource usage. At any time, you can capture a complete memory snapshot for more comprehensive application memory analysis.
· Monitor memory leaks
· Compare memory snapshots
· Monitor memory allocation in real time
Some of Our Great Customers


Measure Code Coverage
AQtime’s code coverage analysis shows you which source files, functions and lines of code have been covered by tests, are untested or only partially tested. This helps you know what additional tests to create and how to improve your existing tests.
· Find unused or untested code
· Selective coverage
· Convenient analysis of coverage data
· Merge coverage data
Test Fault Tolerance
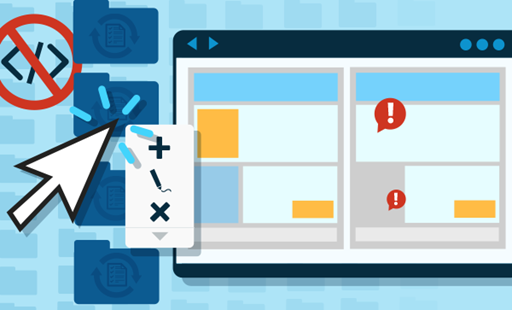
AQtime includes a Failure Emulator that lets you simulate faults during your application run and monitor their impact on the application behavior. The Failure Emulator does not need to make any changes in your application code. You caninject faults into applications with no source code available.
· Simulate various fault types
· Integrated debugging aids
· No source code changes

© Copyright 2000-2023 COGITO SOFTWARE CO.,LTD. All rights reserved