|
|
|
|
|
|
|

.NET Memory Profiler
.NET Memory Profiler is a powerful tool for finding memory leaks and optimizing the memory usage in programs written in C#, VB.NET or any other .NET Language. With the help of the profiling guides, the automatic memory analyzer, and specialized trackers, you can make sure that your program has no memory or resource leaks, and that the memory usage is as optimal as possible.

Find Memory Leaks
Even though the .NET runtime has a garbage collector, memory leaks are still a reality. A memory leak occurs when an instance that is no longer needed is still, unintentionally, reachable from a root (e.g. a static field).
By using .NET Memory Profiler, you can detect memory leaks long before they are noticed in the Task manager and before they create an out-of-memory error. Even a minor memory leak can cause problems in a long-running program.
.NET Memory Profiler will:

Guide you through the process of detecting memory leaks
An interactive profiling guide will give you step by step instructions on how to detect a memory leak.

Help you identify memory leaks by collecting and comparing snapshots
Snapshots of the memory usage can be collected before and after a user action is performed (e.g. opening and closing a document). Comparing the snapshots will provide information about new instances created by the action. You can then investigate the new instances further to find out whether they are part of a memory leak or not.

Automatically analyze memory usage and highlight potential memory leak issues
The automatic memory analyzer will help you locate potential memory leaks, such as left-over Event Handlers.

Present root paths of new instances that are potential memory leaks
The root paths tell you why the instance has not been garbage collected. This is the most important information you need when finding out how a memory leak occurs.

Give you information about how the instances were created
To understand why an instance is unintentionally kept alive, it is crucial that you know how it was created, and how other instances in the root path was created. .NET Memory Profiler will present the allocation call stack for each instance in the snapshot.

Visualize how an instance is being used
The instance graph will give you the full picture of a how a suspected memory leak instance is being used, how it is related to other instances, and, maybe most importantly, how roots are preventing it from being garbage collected.

Reduce Resource Usage
Native resources, such as Win32 heap memory, window handles, and file handles, are used in a managed .NET program as well. Even though they may not be directly used by your application, they can be indirectly used by the .NET runtime, Windows, and native libraries.
By using .NET Memory Profiler, you can make sure that native resources are released as quickly as possible, and that there are no resource leaks.
.NET Memory Profiler will:

Help you make sure that all instances are correctly disposed
The dispose tracker will give you information about disposable instances that are not correctly disposed. Disposable instances often wrap native resources. Failing to dispose an instance can delay the release of a native resource, or even cause a resource leak.

Provide real-time information about resource allocations and all resource instances
The unmanaged resources tracker will collect information about all native resources and allocations. This information is presented in the real-time view, giving you a good overview of the resource usage of your program.

Help you identify resource leaks by collecting and comparing snapshots
When the resource tracker is enabled, the snapshots include information about resource instances and allocations. By comparing snapshots, it will be easier for you to detect resource leaks (similar to the way managed memory leaks are detected).

Make Your Programs Run Faster
If your program uses too much memory, performs too many allocations, or has bad allocation patterns, the performance will suffer. This can affect not only your program, but other programs as well. With .NET Memory Profiler, you will get the information you need to ensure that the memory usage of your program is as efficient as possible.
.NET Memory Profiler will:

Help you optimize memory and resource usage
The heap-utilization tracker will tell you how the managed heaps are used and indicate bad allocation patterns. The dispose tracker will help you make sure that disposable instances are correctly disposed. Together, this information can help you optimize the memory and resource usage of the application.

Provide information about the peak memory usage of your application
By using the new peak snapshot collection, you can get detailed information about the peak managed memory usage of your application.

Detect duplicate instances
The automatic memory analyzer in .NET Memory Profiler will give you detailed information about all duplicated instances. This includes simple duplicates, like duplicated strings, and complex duplicates, such as large identical hash tables. This information will help you avoid unnecessary memory usage caused by the duplicates.

Present real-time memory and resource information
The profiler presents real-time information about all .NET instance allocations performed on the garbage collected heap and all instances that reside on the heap.

Help you make sure that all instances are correctly disposed
The dispose tracker will give you information about disposable instances that are not correctly disposed. Disposable instances often have finalizers and wrap native resources. Failing to dispose an instance can cause costly finalization and delay the release of a native resource.

Investigate Memory Problems in Production Code
.NET Memory Profiler provides the most detailed information when you start the profiled application from the profiler. However, this is not always possible when troubleshooting memory problems in a production application, e.g. when the problem occurs on a customer’s computer and cannot be easily reproduced.
With .NET Memory Profiler you can:

Attach to a running process
When you cannot start the profiled application from the profiler for any reason, you will still be able to attach to a running process and get detailed memory usage information.

Gather memory information on machines where .NET Memory Profiler is not installed
The NmpCore tool is a free standalone tool for collecting snapshots and creating session files on machines where .NET Memory Profiler is not installed.
It requires no installation and make it easy to retrieve memory data from remote sites.

Profile a process on a remote machine
Remote profiling allows you to use a development computer to profile a process running on a computer where you do not want to or cannot install the full profiler. The NmpCore tool is used on the remote computer to provide remote profiling access to the computer.

Import memory dump files
Sometimes all you have is a memory dump file. Import it using .NET Memory Profiler, and you can easily get a visual overview of the memory usage of the process.

Automate Memory Testing with .NET Memory Profiler
Be confident that you don't have any memory leaks in your application by automating memory testing using .NET Memory Profiler.
With .NET Memory Profiler you can:

Automatically detect memory leaks
The .NET Memory Profiler API makes it possible to automatically detect memory leaks and control the profiler from within the profiled program.

Declare expected memory usage using method attributes
Add attributes to your method to define the expected memory usage. When profiling the application, the profiler will verify the expected behavior and notify you if the verification fails.

Include memory assertions in your unit testing
The testing can be fully automated by using a unit testing framework, such as NUnit, MSTest, or XUnit, and running the profiler using the free NmpCore tool or the MsBuild NmpCore task.

Run unit tests under the profiler
By using the "Run unit tests under profiler" command in Visual Studio, or by using the CodeRush test runner, you can easily run your unit tests under the profiler.

Improve Your Visual Studio Debugging Experience with .NET Memory Profiler
Start profiling, open session files, and get additional memory information while debugging, directly from Visual Studio. .NET Memory Profiler is fully integrated with Visual Studio, so you never have to leave your development environment.
With .NET Memory Profiler Visual Studio integration you can:

Easily start profiling your Visual Studio projects
Simply select the Start memory profiler command, and .NET Memory Profiler will build your project and start profiling. View real-time memory usage, collect snapshots and quickly switch between source code and memory usage information.
If the start-up project is an Azure project, the profiler will start profiling the Azure compute emulator and its related processes.

Improve your debugging experience
You can debug and profile the memory usage at the same time. Snapshots can be collected while stopped at a breakpoint. Use the profiler visualizer from a watch window and get access to all the information you might need about an instance, such as a full instance graph and the allocation call stack.

Run unit tests under the profiler
By using the "Run unit tests under profiler" command in Visual Studio, you can now easily run your unit tests under the profiler.
What's New in .NET Memory Profiler 5.7?
The major new features of .NET Memory Profiler 5.7 are:
Improved support for .NET Core 3.x and .NET 5.0
This includes a new debug symbols reader with support for portable PDBs, delegate target method identification, and WPF profiling support.
New implementation of debug profiling
The new implementation makes use of the debugger API available in Visual Studio 2015 and later, and no longer relies on undocumented behavior that could potentially cause problems (support for Visual Studio 2012 and 2013 has been dropped in version 5.7).

New implementation of unit test profiling
The new implementation is based on the new unit test data collector (NmpDataCollector) and supports the latest releases of Visual Studio 2019 and Visual Studio 2019 Preview, as well as Visual Studio 2017 (this feature is not implemented in Visual Studio 2015).
With the new debug profiling implementation, it is now also possible to debug unit tests that run under the profiler.
NOTE! Even though the unit test profiling is based on NmpDataCollector, it is not required to install the NmpDataCollector package to run unit tests under the profiler within Visual Studio.
Unit test data collector for VSTest
NmpDataCollector is a VSTest data collector that can be added to a unit test project. It is available as a NuGet package and makes it very easy to run unit tests under the profiler within the build process, e.g. a CI/CD pipeline.
Hybrid inspection snapshots
Normally the profiler will try to allow the runtime to garbage collect as many instances as possible before collecting a snapshot. This significantly reduces the risk of falsely identifying instances as memory leaks. However, when investigating and optimizing memory utilization, e.g. using the heap utilization tracker, it is better to get information about the actual memory usage at the time of the snapshot.
The new inspection snapshot will collect the memory usage information as it is, including unreachable instances. This is the same type of snapshot that is collected when doing inspection profiling, but with all the additional information that is available for a standard snapshot, e.g. allocation call stacks.

Identification of delegate target Method
When profiling a process running under .NET Core 3.0 or later, the profile will identify the target Method of a delegate. This will make it easier to identify the reason why a delegate was created or why it has not been removed. This is especially important when allocation call stack information is not available, e.g. when attaching or investigating a memory dump file.

WPF cleanup support in .NET Core 3.x and .NET 5.0
As part of the memory cleanup the profiler tries to perform before collecting a snapshot, it triggers the cleanup of stale data bindings in WPF. This was implemented in .NET Memory Profiler 5.5, but caused problem when profiling a WPF application running under .NET Core 3.0 or later. Now WPF cleanup is fully supported under .NET Core 3.x and .NET 5.0.
Identification of instances in the pinned heap
.NET 5 has introduced a new managed heap, the pinned heap, where it will place instances that are allocated as pinned (using GC.AllocateArray or GC.AllocateUninitializedArray). .NET Memory Profiler will identify instances that are placed in this heap, using an analysis issue and in the native memory view.

.NET Memory Profiler Features
On this page you will find a summary of the things you can do with .NET Memory Profiler.
Standard Profiling
Using a wizard you can easily start profiling the following types of processes:
Production Code Profiling
A wizard is also provided for connecting the profiler to already running processes, or to import memory dump files. This is especially useful when profiling problems in a production application.
Use the "attach to" API provided by .NET runtime 4.0 and later to collect snapshots faster and more securely.
Use the NmpCore tool to collect memory snapshots on machines where .NET Memory Profiler is not installed.
Remote Profiling
Remote profiling allows you to use a development computer to profile a process running on a computer where you do not want to or cannot install the full profiler. The NmpCore tool is used on the remote computer to provide remote profiling access to the computer.
Profiling Levels
The profiling levels allow you to select the amount of information to collect from the profiled application. The medium profiling provides a good balance between the amount of data collected and the performance impact of the profiler. When profiling a very complex and memory consuming application, the Low or Very low level might be more appropriate, as the memory and performance overhead is much lower. To get full memory information, including heap utilization, use the High level.

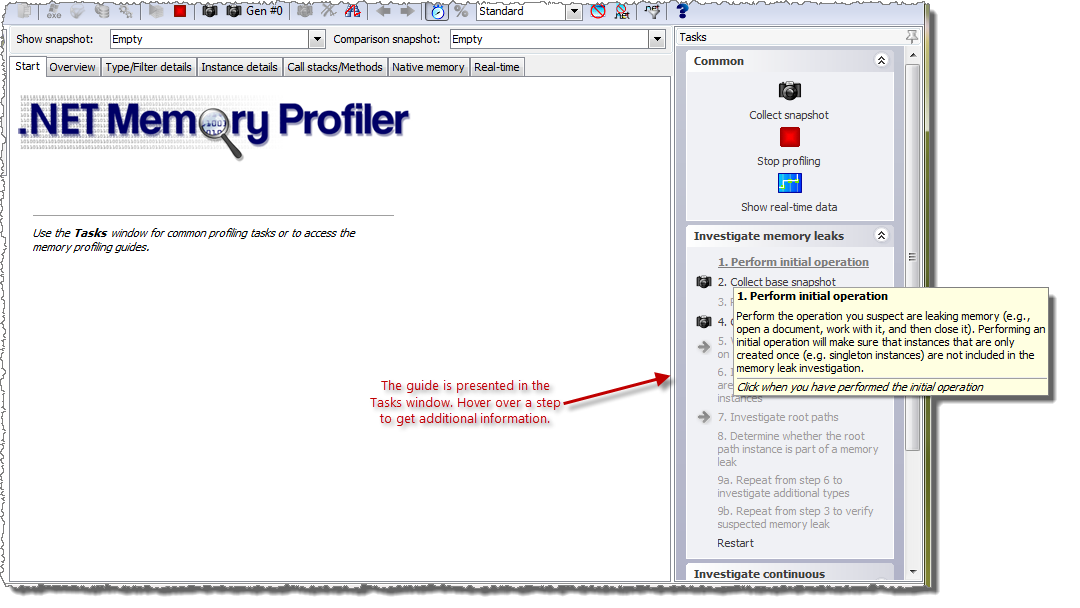
Guided Profiling
The profiler guides provide interactive step-by-step instructions that will help you with common memory profiling tasks, such as memory leak investigations.

Updated! Snapshot Collection
Collecting snapshots allows detailed information about the garbage collected heap to be presented. If unmanaged resource tracking is enabled then detailed information about unmanaged resources is also presented.
New! Hybrid inspection snapshots provide a view of the memory usage information as it is, including unreachable instances.
Snapshot Comparison
Comparing snapshots allows information about the change in the heap data to be presented. This information can for instance be used to find memory leaks by locating instances that should have been collected. If unmanaged resource tracking is enabled then change information about unmanaged resource instances is also presented.
Snapshot Filters
The snapshot filters allows you to drill down on a subset of the instances and allocations in a snapshot comparison.
Automatic Memory Analyzer
Don't know where to start when analyzing a memory snapshot? With the automatic memory analysis, you will get tips and warnings regarding common memory usage issues. This will help you locate potential memory leaks and optimize memory and resources usage.
More than 30 memory issues are identified by the memory analyzer, ranging from warnings about likely memory leaks, to information about how memory is used (e.g. by the ASP.NET cache).
Updated! Visual Visual Studio 2015, Visual Studio 2017, and Visual Studio 2019 Integration
Visual Studio integration allows you to start profiling C# and Visual Basic.NET projects from within the development environment, as well as open previously stored session files.
.NET Memory Profiler runs as a separate process even when profiling from Visual Studio. This allows the profiler to work with much larger sessions and profile processes with much higher memory usage. It also provides better isolation between Visual Studio and the profiler, better performance, and reduced conflicts with third-party components.
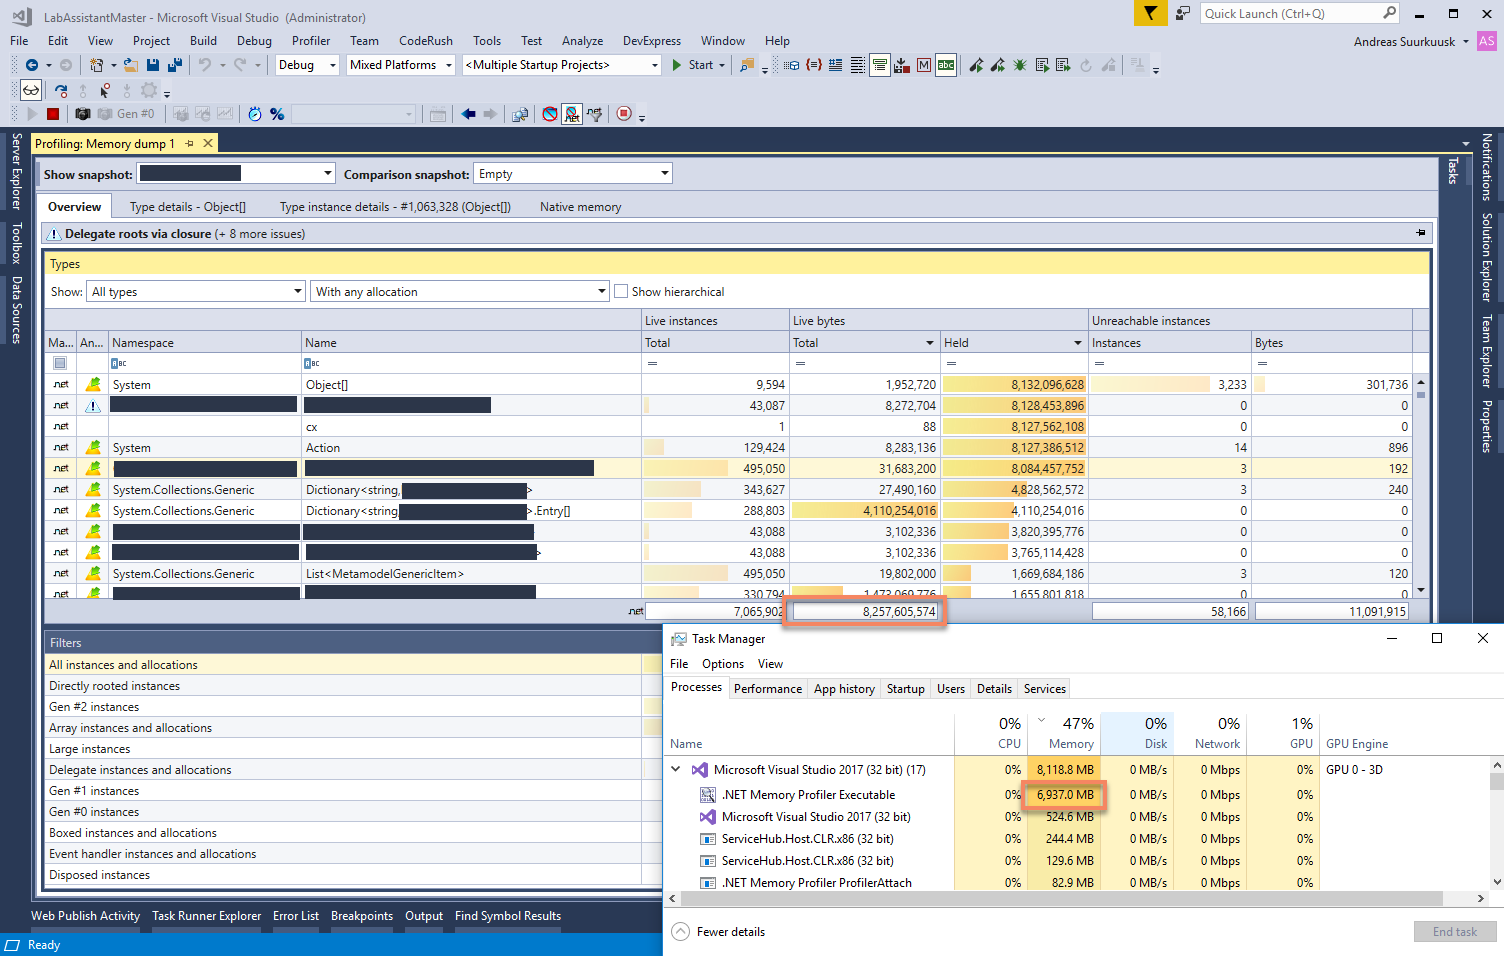
The screenshot above shows the import of a memory dump import of a file larger than 8 GB. After the import, .NET Memory Profiler consumes close to 7GB of memory, which would not be possible within the Visual Studio process.
Updated! Debug Profiling
Using Debug profiling you can launch the debugger and profiler simultaneously and get profiler integration in the watch windows (Watch, Locals, Auto, and debugger tool tips) – and you can collect snapshots while you have stopped at a breakpoint. You start debug profiling using the command Profiler->Debug with Memory Profiler in Visual Studio.
Updated! Run Tests under the Profiler
By using the "Run unit tests under profiler" command, you can run your unit tests under the profiler.
Run Tests under the Profiler using the CodeRush test runner (by DevExpress)
If DevExpress CodeRush is installed in Visual Studio, it is possible to run unit tests under the memory profiler using the CodeRush test runner. This is a more convenient and intuitive than using the "Run tests under memory profiler" command.
Duplicate Instances Detection
The automatic memory analyzer in .NET Memory Profiler will also give you detailed information about all duplicated instances. This includes simple duplicates, like duplicated strings, and complex duplicates, such as large identical hash tables. This information will help you avoid unnecessary memory usage caused by the duplicates.
Instance and Allocation Filters
Using filters you can get information about instances and allocations that share a common characteristic, e.g. all allocations and instances that are derived from a specific type, all instances that are directly referenced by a root, or all allocations performed by a specific method. By combining filters you can get very specialized information, e.g. all instances of a specific type that are directly referenced by a root and allocated by methods in a specific assembly.
Peak snapshot collection
Peak snapshots can be used to get details information about the peak memory usage of the application. The peak snapshot includes information such as the total number of instances and bytes before the garbage collection, the number of instances and bytes collected, and the number of instances and bytes that are unreachable but still exist on the GC heap.
Dependency Property Evaluation
When profiling a WPF or Silverlight application, the profiler will evaluate Dependency Properties. The properties will be presented as "pseudo-fields" in views like "Referenced by," "References", "Field values", and "Instance graph" under the Type instance details page.


Call Stack Information for all Instance Allocations
The allocation call stack is stored each time a managed instance or unmanaged resource instance is allocated. This provides very useful information about why and how instances are created.
The call stacks reducer can be used to decrease memory usage and improve performance, by automatically skipping less important frames from call stacks.
Full native call stacks are collected using a fast native stack walker. This will give you a good understanding of how native memory and resources are used by your application.
If DevExpress CodeRush is installed in Visual Studio, the decompiler feature in CodeRush will be used to decompile methods in presented call stacks.
Updated! Type, Resource, and Filter Details
The Type/Resource/Filter Details view is one of the Heap Snapshot views. It shows the details of a selected type or resource, which include:
Updated! Instance Details
Instance Details is one of the Heap Snapshot views. It shows the details of a selected instance, which include:
For a managed type instance the following additional information is presented:
For an unmanaged resource instance the following additional information is presented:
Updated! Instance Graph

The instance graph gives you a visual overview of how a managed instance is being used, how it is related to other instances, and, maybe most importantly, how roots are preventing it from being garbage collected.
Call Stacks and Methods
Call Stacks/Methods is one of the heap snapshot views. It shows information about all call stacks and methods in which allocations have been performed.
Native Memory
Native memory information (i.e., memory that is managed by the operating system rather than the Common Language Runtime) can be presented for a selected heap snapshot, the profiled process and any other process running on the computer.
Dispose Tracker
The dispose tracker is used to identify instances that are not properly disposed. It can also be used to identify memory leaks by pin-pointing instances that have been disposed, but not garbage collected.
Profile Multiple Processes in the same Session
In the Enterprise edition of .NET Memory Profiler, the profiler can profile all child processes that are created by the profiled process. This simples profiling of processes that are started using a .NET implemented launcher process. It is also possible to profile all startup projects in a Visual Studio solution, within the same profiling session.
Profile Multiple Runtimes
If multiple versions of the .NET runtime are loaded into the profiled process, a runtime selector becomes available in the main window.

Using this selector you can select for which runtime the information should be presented, or whether information should be presented for all runtimes.
Focus on a Single Runtime or AppDomain
The runtime and AppDomain tracker allows you to investigate memory usage in a specific runtime or AppDomain. This can be particularly useful when profiling ASP.NET applications that are running in separate AppDomains.
Updated! Real-time Data Collection
Real-time data about the activity on the GC heap can be collected and presented. This information gives a good overview over how the memory is being used during the life time of the profiled process. The real-time information includes information about global statistics such as the total number of instances, the number of GCs performed etc. It also includes real-time information about every type in the profiled process. The information is presented both numerically and graphically.

If unmanaged resource tracking is enabled then information about unmanaged resource instances is also included in both the numerical and graphical real-time view.

Performance counters can also be added to the real-time graph. The performance counter may be associated with the profiled process, or it can be any other performance counter available on the system.

External sessions can be added to the real-time graph, allowing data collected from multiple session to be compared.
Profiler Projects
.NET Memory Profiler projects can be used to save all settings on how you want to profile a process, making it easier to use different settings for different applications.
.NET Memory Profiler projects is also used to keep track of session files related to the project. The profiler projects explorer shows all loaded projects and their session files and allows you to compare snapshots between different sessions. This is particularly useful when doing automated testing and you want to check whether the memory usage has changed between different builds of a program.
Heap Utilization Tracker
The heap utilization tracker can be used to analyze and optimize the way the garbage collected heap is used.
GC Handle Identification
GC handles are used to create handles to managed instances. .NET Memory Profiler tracks the internal GC handles that are created by the runtime itself or by using the WeakReference and GCHandle types.
The collected GC handles information is presented as a <GCHandle> pseudo-type in the heap snapshot views.
Updated! Automatic Testing using the .NET Memory Profiler API
The .NET Memory Profiler API can be used to control the profiler from within the profiled process, and to detect potential memory leaks using assertions. This API is very well suited for doing automated testing of memory usage errors, for instance by using a unit testing framework like NUnit or MSTest.
New! NMP Data Collector
The NMP Data Collector simplifies the profiling of unit tests.
MSBuild NmpCore Task
The NmpCore tool is available as an MSBuild task. This makes it easier to use NmpCore for automated memory testing during build, e.g. when using continuous integration.
Command Line Profiling
Command line arguments can be supplied to the profiler. Together with the .NET Memory Profiler API this allows the profiler to be used in an automated testing environment, without any user interaction.
Support for .NET Framework 2.0, 3.0, 3.5, 4.0, 4.5, 4.6, 4.7, and 4.8
Updated! Support for .NET Core 1.x, 2.x, and 3.x
New! Support for .NET 5.0
.NET Memory Profiler can be used to profile processes running under all versions of .NET Framework and .NET Core, except .NET Framework 1.x.

© Copyright 2000-2025 COGITO SOFTWARE CO.,LTD. All rights reserved


