|
|
|
|
|
|
|
QCChart2D Charting Tools for Silverlight
Feature Summary
Silverlight 4.0 and 5.0 -The software is based on the Silverlight 4.0 API and is forward compatible with Silverlight 5.0.
Visual Studio 2010, 2012, 2013, 2015 -The software is compatible with Visual Studio 2010 and higher. All example program projects are in Visual Studio 2010 format.
SharpDevelop - The software is also compatible with SharpDevelop 3.X and higher. SharpDevelop is a free IDE for C# and VB developers writing for the Silverlight/WPF/.Net platform.
Plot Types - Line plots, area plots, bar plots, line marker plots, floating bars, scatter plots, group plots, open-high-low-close plots, error bar plots, pie charts, contour plots, candlestick plots, line gap plots, cell plots, histogram plots, arrow plots, bubble plots, polar plots, multi-line plots, stacked line plots, box-whisker plots, floating stacked bar plots, ring plots, antenna plots, versa plots.. An unlimited number of plot types can be combined in the same chart.
Datasets - Datasets hold the data plotted in the chart. Charts can plot an unlimited number of datasets, each dataset can contain an unlimited number of data points. Datasets can hold numeric and .Net DateTime based data. Mark data points invalid, forcing a break in plotted lines.
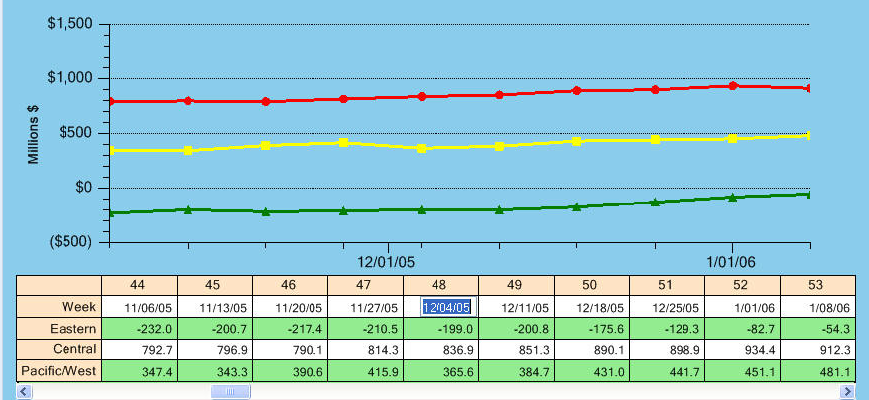

Dataset Viewer - A new dataset viewer class will display simple and group datasets in a grid-like table. The grid can be positioned anywhere on the chart. Individual grid cells can be edited and the associated chart immediately updated using the synchronize feature.
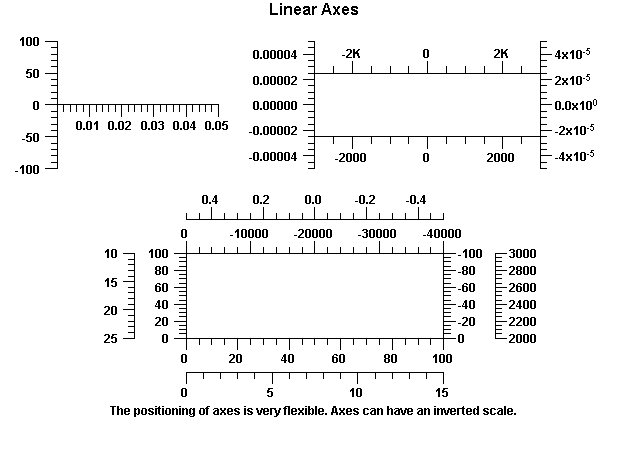
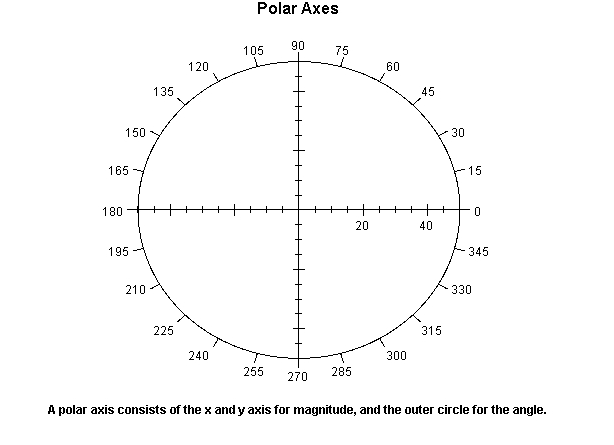
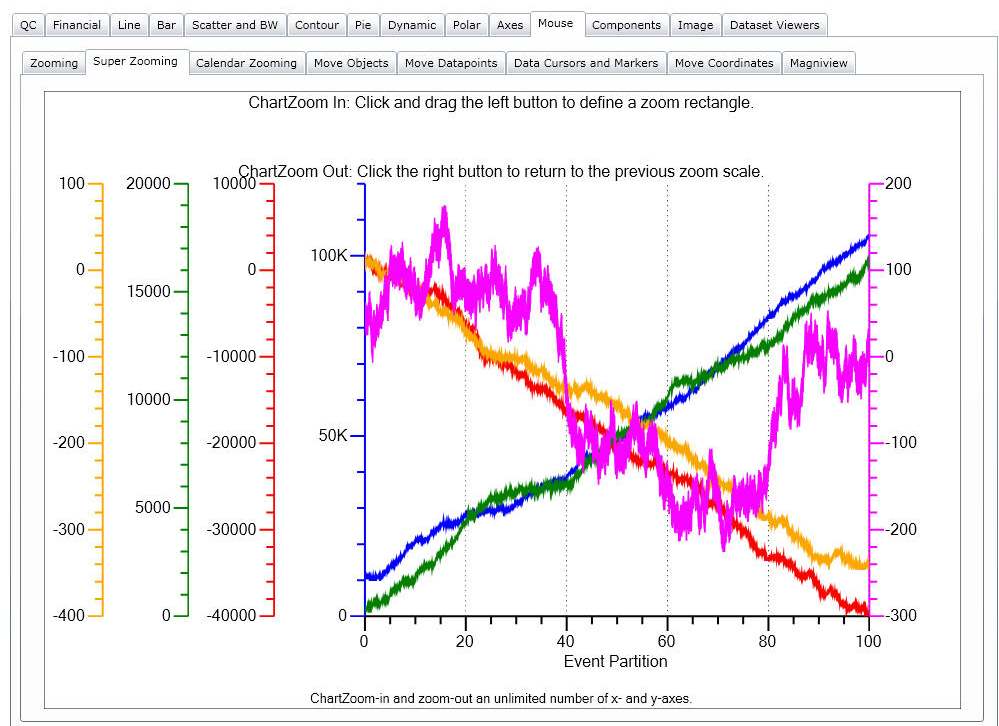
Coordinate Systems - Linear, logarithmic, time/date and polar coordinate systems. An unlimited number of coordinate system, and axes, can be overlaid in the same plotting area of a graph.
Time/Date Coordinate Systems - The time/date scale is specified using .Net DateTime objects. The time/date scales take into account the varying number of days in months and years. The scales can also take into account non-continuous time/date scales where a 5-day week is used, or where a full day consists of a specific time interval that can be something less than a 24-hour day. For example, it is possible to define a time/date scale where weekends are excluded and the day consists of the hours between 9:30 AM and 4:00 PM. Starting with Rev. 2.0, the Time/Date scale can be either horizontal or vertical.
Axis Labels - Axes can have decimal, exponential, time, date, elapsed time, string and multi-line labels. Programmers can define custom numeric and time/date axis labels.
Chart Titles - Charts can have a main title, a subhead and a footer. Axes can have horizontal and vertical titles.
Grid Options - Grid lines of any line style and color can highlight major and minor axis tick marks.
Import .Net Image object - Use .Net Image objects as plot elements in a chart, or as a background object.
Legends for All Plot Types - Position horizontal and vertical legends anywhere in a chart. A chart can have an unlimited number of legends.
Graph Annotations - Add an unlimited number single and multi-line text objects, arrows and geometric objects to a chart.
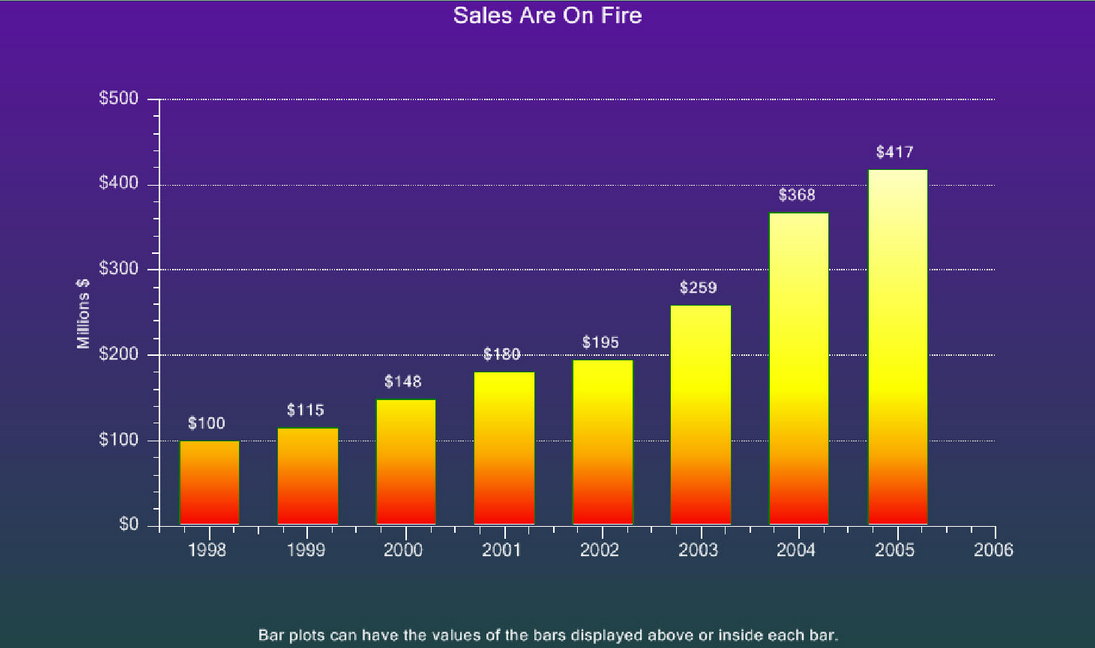
Multi-Color Gradients - Bars and other area fill objects can be filled using multi-color gradients. Mult-color gradients can be mapped to the object, the plot are of the chart, or the entire graph.
100% Managed .Net Code - The software is entirely written in C#, resulting in provide better performance and scalability. Managed .Net code makes applications easier to deploy and maintain.

© Copyright 2000-2023 COGITO SOFTWARE CO.,LTD. All rights reserved


