|
|
|
|
|
|
|
Nevron Gauge for SSRS
The most advanced gauge report item available for SQL Server Reporting Services 2005, 2008, 2008R2, 2012, 2014, 2016 and 2017.
Advanced Gauges and KPIs for Reporting Services
Nevron Gauge for SQL Server Reporting Services (SSRS) is an advanced report item that delivers a complete set of gauge types, highly customizable axes, tight data integration and unmatched visual effects to your reports. It improves your report authoring experience with its polished visual editors, refined settings and well-organized structure.
Nevron Gauge for SSRS is a must-have tool for any advanced Business Intelligence, Scorecard, Presentation, Scientific or general purpose report. Whether you are looking to display complex KPIs or just enhance existing reports with advanced gauges, state indicators and numeric displays, Nevron Gauge for SSRS can help you achieve your goals quickly and easily.
COMPLETE SET OF GAUGE TYPES
The complete set of radial (circular) and linear gauges, numeric displays and state indicators, that are all loaded with advanced options ensures that you have a superior set of KPI visualization methods “out of the box”.
Multiple gauge areas, ranges, pointers and axes, and fine control over all aspects of the gauges layout and appearance are just a few of the gauge related features, that make this report item essential for the enterprise quality of your reports.
ADVANCED AXIS MODEL
The industry leading gauge axes model, backs the scaling of data inside radial and linear gauges. It automatically resolves axis labels overlapping in the complex radial case and preserves your font settings regardless of the way in which you resize the gauge.
Multiple axes with advanced axis positioning, ticks, stripes, sections, const lines and ranges and intelligent non-overlapping axis labels are just a few of the axis related features, that make this report item the prime tool for enterprise SSRS reporting.
VISUAL CONFIGURATION AND DATA INTEGRATION
The report item provides numerous editors, allowing you to easily modify the gauge appearance and customize all elements of your gauges - quickly and completely visually. Changes that you make to the gauge are previewed in real time so that you can instantly see the effect of your settings.
The report item features a sophisticated data binding architecture that allows you take full advantage of the built-in data aggregation features available in SSRS – again completely visually, by just dragging and dropping dataset fields in the report item adorner areas.
The combination of easy-to-use and rich visual editors, incredible gauge flexibility and tight data integration, is why this report item is a prime choice for report authors that seek the ultimate KPI tool for SSRS.
JUST A FEW OF THE OTHER SSRS GAUGE FEATURES...
And many more you will not find anywhere else...
Support for all versions of SQL Server and Visual Studio (SSDT) since 2008
Nevron Gauge for SQL Server Reporting Services introduces a new level of data visualization, designed to extend your reports within SSRS 2008, 2008R2, 2012, 2014, 2016 and 2017 editions.
Support for Multiple Gauge Areas
Nevron Gauge for Reporting Services supports unlimited number of gauge areas. Each gauge area has its own gauge type and the areas can be automatically or manually arranged. Gauge areas can be nested into one another to create sub gauges.
Support for Multiple Titles
Nevron Gauge for Reporting Services supports unlimited number of titles which can be manually positioned or docked to gauge, gauge areas and gauge plot areas.
Support for Gauge Templates
Nevron Gauge for Reporting Services supports saving and loading templates. Save the gauge state from the designer to XML and then import it in in a different report item. The state generated by the VS2005, VS2008 and VS2010 report items is compatible meaning you can easily convert reports generated with different versions of Visual Studio.
Support for Code Customization
Nevron Gauge for Reporting Services supports customization through C# code, which allows you to use the full Nevron Chart for .NET API in SSRS.
Gauge Types
Nevron Gauge for SSRS provides support for various Radial (Circular) Gauges, Linear Gauges, Numeric Display panels and State Indicators.
Gauge Formulas
Gauges are designed to provide data analysis to sets of numeric values. Gauge formulas can be applied to the aggregated sets applicable to axis ranges {min and max}, ranges {begin and end} and pointer and numeric display values. Nevron Gauge for SSRS includes various types of data analysis formulas such as: Min, Max, Average and more.
Gauge Axes
Nevron radial and linear gauge types support an unlimited number of axes, packed with a complete set of features designed to solve even the most complex gauge requirements.
Gauge Axes Ranges
Nevron radial and linear gauge types support an unlimited number of ranges. Ranges help you visualize the coverage of a values range on a certain axis.
Gauge Pointers
Radial and linear gauge types support an unlimited number of pointers. Pointers help you visualize a value on a certain axis. Radial gauges support numerous needle styles and both linear and radial gauges can display pointers as markers.
The Gauge for SSRS offers a full range of advanced Gauge types, State Indicators and Numeric Displays that give you a more meaningful way to display KPI's (key performance indicators), dashboards, and other critical data.
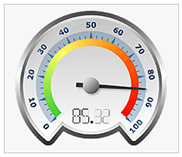
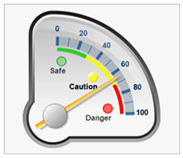
Radial / Circular Gauges
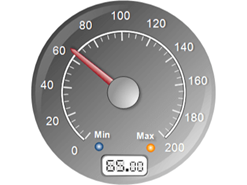
The SSRS Gauge Radial gauges displays axes, ranges and pointers in a circular fashion.
Radial Gauge Subtypes:
Radial, Quarter North East, Quarter North West, Quarter South West, Quarter South East, Half North, Half South, Half West, Half East and Custom. When using Custom subtype the user can specify custom begin angle, sweep angle, border style etc.
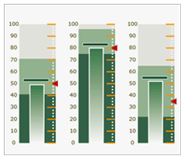
Linear Gauges
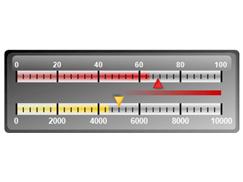
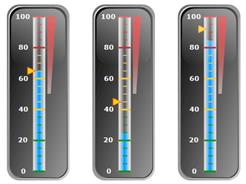
The SSRS Gauge Linear gauges displays axes, ranges and pointers in a linear fashion.
Linear Gauge Subtypes:
Horizontal and Vertical.
Numeric Display
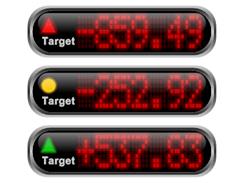
The SSRS Gauge Numeric Display panel displays values in a fashion similar to a LED displays.
Numeric Display Styles:
Seven Segment Normal, Seven Segment Rounded, Seven Segment Rectangular, Fourteen Segment Normal, Fourteen Segment Rectangular, Fourteen Segment Inset, Matrix Rectangle and Matrix Circle.
State Indicators
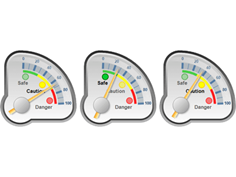
The SSRS Gauge State Indicators are supplementary gauges, typically used to visually prompt the user that a value has entered a critical range.
Unlimited Number of Axes per Gauge
Radial and Linear gauge types support an unlimited number of axes, packed with a complete set of features designed to solve even the most complex gauge requirements.
Advanced Axis Positioning Options
Axes can be docked to the gauge sides (or rim) or arbitrary positioned in the gauge model space. In addition you have control over the begin / end axis position relative to the gauge area.
Ruler
Control over the ruler position and appearance.
Ticks
Support for major and minor ticks with control over their appearance and position.
Axis Stripes
Axis Stripes highlight repeating ranges of data on the gauge background, with a controllable show/hide pattern.
Axis Sections
Axis Sections conditionally modify the appearance of axis ticks, gridlines and labels, provided they are within a user-specified data range(s). This feature helps you highlight important ranges of data along the axis.
Label Layout
Nevron Gauge for Reporting Services provides advanced axis-label layout options, which let you resolve complex axis-label overlapping cases.
Label Formatting
Label Formatting controls the formatting of values along numeric scales. Many advanced options for currency, percentage, scientific and date time label formatting are available.
Unlimited number of Indicators
Linear and Radial Gauges support an unlimited number of pointer and range indicators.
Gauge Ranges
Ranges help you visualize the coverage of values range on a certain axis. You have full control over the range offset from scale, appearance and paint order.
Gauge Pointers
Pointers help you visualize a value on a certain axis. Radial gauges support numerous needle styles. Both linear and radial gauges can display pointers as markers. Both marker and needle pointers allow you to have full control over the pointer offset from scale, appearance and paint order.
Gauge Formulas
Gauges are designed to provide data analysis to sets of numeric values. Gauge formulas can be applied to the aggregated sets applicable to axis ranges {min and max}, ranges {begin and end} and pointers, and numeric display values. Nevron Gauge for SSRS supports are the following gauge formulas:
Following is a brief list of some of the most important additional customization options that are visually exposed by the gauge designer:
Titles
Per Indicator (Range or Pointer) Properties
Data Groupings Editors
Rendering
Appearance Customizations
Gauge Code Customization
Nevron Gauge for Reporting Services supports customization through C# code, which allows you to use the full Nevron Chart for .NET API in SSRS.

© Copyright 2000-2023 COGITO SOFTWARE CO.,LTD. All rights reserved


