|
|
|
|
|
|
|
SPC Control Chart Tools for Java
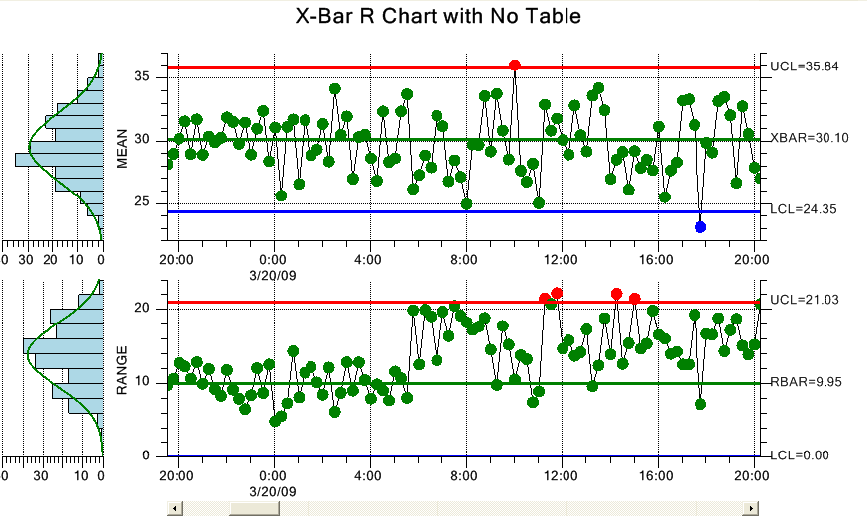
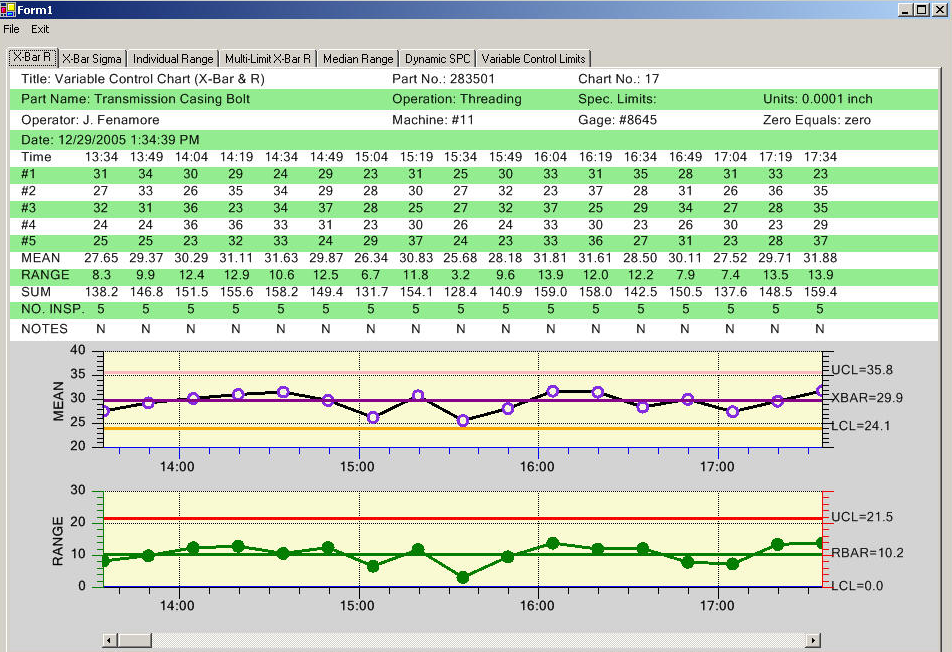
X-Bar R Chart with integrated table support, frequency histograms, scroll bar and customize plot objects
The QCSPCChart SPC Control Chart Tools for Java software is an object oriented, Java based toolkit aimed at developers who want to add static and dynamic quality control charts to their Java applications. Typical users are SPC engineers and other quality control professionals creating .Java- based applications that will be used to monitor critical quality factors in manufacturing, process, and service industries. The feature rich toolkit includes templates for the most common SPC control chart types: variable control charts (X-Bar R, X-Bar Sigma, Individual Range, Median Range, EWMA, MA, MAMR, MAMS and CuSum charts), attribute control charts (p-, np-, c-, u-, and DPMO-charts), frequency histograms, probability charts and Pareto diagrams. The software will automatically calculate SPC control limits using historical data for the supported variable control chart and attribute control chart types. Alarms can be generated for standard +3 sigma control limits, or standard SPC rule sets (WECO, Nelson, Juran, Hughes, Gitlow, AAIG, Westgard and Duncan). Alarms can be color highlighted in the SPC charts and table. It will also calculate process capability ratios (Cp, Cpl, Cpu, Cpk and Cpm) and process performance indices (Pp, Ppl, Ppu and Ppk). Users are able to interact with charts: adding annotations, defining custom tool-tips and editing notes. There is no comparable product for Java available at any price.
Key Benefits
Fast development time because of the use of advanced templates for the most common SPC Control charts
Charts have no limits on the number of data points or time frame
Integrated histograms and tables displays require no programming
Integrate with your database because the software is written and programmed using next generation programming language, Java.
Add SPC charts to your web site by using Java Applet technology.
Never miss an alarm condition, alarms can be strongly highlighted in charts and tables
There are no restrictions on what your program can do, since you can add any feature that you want using Java.
Feature Summary
Java IDE Independent - Tested and compatible with Eclipse, JBuilder and NetBeans.
Windows 32-bit/64-bit Compatible - The software will run as 32-bit on Windows 32-bit operating systems (XP and 32-bit versions of Vista and Windows 7) and as 64-bit on Windows 64-bit operating systems (64-bit versions of Vista and Windows 7). This is a feature of Java programs in general.
Based on the Java Graphics2D API - Compatible with Java components and applications.
100% Java Code - The software is entirely written in Java, resulting in provide better performance and scalability. Java code makes applications easier to deploy and maintain.
New Features in Revision 2.2 - support for Nelson, Juran, Hughes, Gitlow, AAIG, Westgard and Duncan rule sets in addition to the WECO rules. Exisiting rules can be customized, or new rules created using templates. Added MAMR (Moving Average / Moving Range) and MAMS (Moving Average / Moving Sigma), DPMO (Defects per million) charts. As an aid to internationalizations, all of the default (US English language) strings have been moved into a single static class, where they can be initialized at runtime with country specific values.
Variable Control Chart Templates - X-Bar R - (Mean and Range), X-Bar Sigma, (Mean and Sigma), Median and Range, X-R (Individual Range Chart), EWMA (exponentially weighted moving average), MA (moving average), MAMR (moving average / moving range), MAMS (moving average / moving sigma) and CuSum. A special version of the X-Bar Sigma chart supports variable sample sub-group sizes.
Attribute Control Chart Templates - p-Chart (Fraction or Percent of Defective Parts, Fraction or Percent Non-Conforming), np-Chart (Number of Defective Parts, Number of Non-Conforming), c-Chart (Number of Defects, Number of Non-Conformities ), u-Chart (Number of Defects per Unit, Number of Non-Conformities Per Unit ), and DPMO-Chart (Number of Defects per Million). The p-Chart and u-Chart templates come in versions which support variable subgroup sample sizes.

Customize Chart Objects - All of the plot objects created in the SPC chart templates are accessible to the programmer, allowing tremendous flexibility in the look of the SPC charts.

© Copyright 2000-2025 COGITO SOFTWARE CO.,LTD. All rights reserved


