|
|
|
|
|
|
|
QI Macros
Spend Too Much Time Making Charts?
Frustrated with Six Sigma Project Documentation?
You are not alone. Most Six Sigma and SPC software treats your valuable time like it’s an abundant resource; but it’s not. Software should do as much of the work as possible. That’s why we created the QI Macros SPC Software for Excel as a shortcut to Lean Six Sigma results.
“There's no doubt in my mind that QI Macros is the simplest product to use and a much more effective solution for the vast majority of business problems than are SAS, Minitab, JMP or any other of the much more expensive statistical software packages.”
- Jack B. ReVelle, Ph.D. Consulting Statistician
QI Macros Add-In for Excel (Since 1997)
QI Macros Overview
QI Macros Turns Microsoft Excel into a Power Tool for Lean Six Sigma and SPC. It draws control charts, pareto charts, histograms, fishbones, and more. The four "wizards" slash the Six Sigma learning curve by helping beginners automatically get the right chart or statistic.
QI Macros works right in Excel — no need to move or copy data into another application. Just select your data and choose the chart or wizard from the QI Macros menu. Works in PC (Windows 7, 8, and 10), Macintosh (OSX and macOS) and Excel Excel 2010-2019, Office 365.
SPC Software for Excel
It's Easy to Create SPC Charts and Six Sigma Projects with QI Macros Add-in for Excel
Select Your Data, Click on a Chart and QI Macros Will Draw the Chart for You
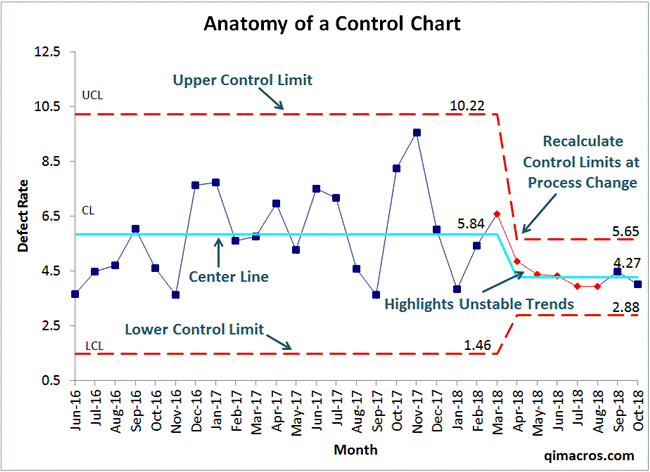
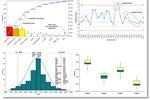
SPC Chart Examples Created by QI Macros
“QI Macros SPC software has outstanding value, particularly when compared to software packages that cost much more. It has all the functionality needed for leading, managing, and performing the technical work of quality/process improvement and product/service development efforts. The user friendliness is excellent. The training and technical support is excellent. Highly recommended!”
- Allen Gates
Univ of Wisconsin, Six Sigma Instructor
Data Mining Wizard
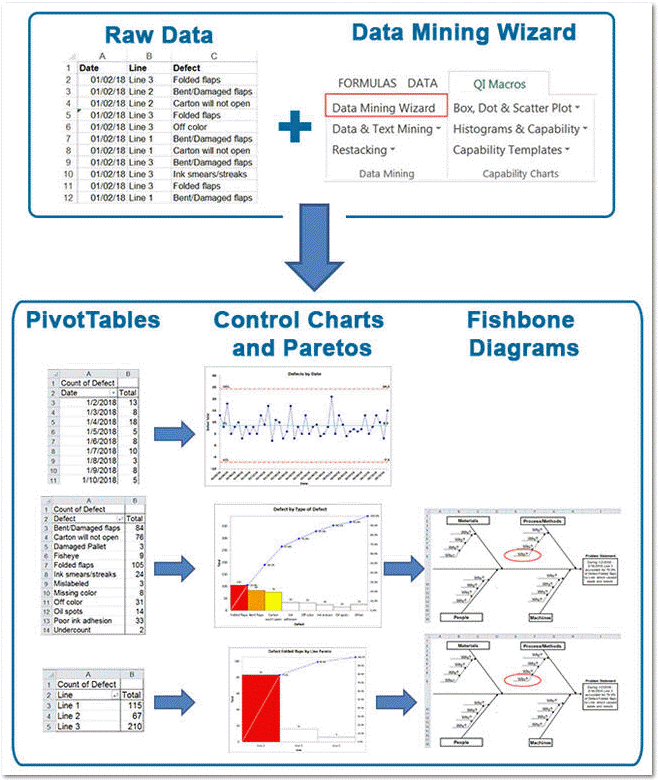
Start with a spreadsheet of raw data and, with just one click, QI Macros data mining wizard will analyze your data and create: pivottables, control charts, pareto charts and fishbone diagrams.
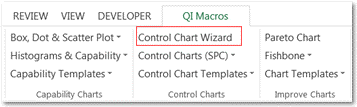
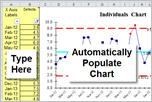
Control Chart Wizard
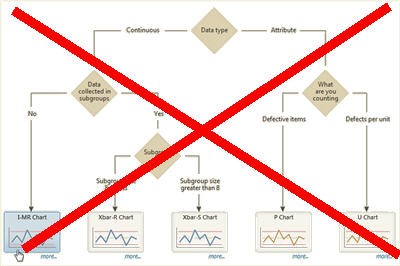
Analyzes your data and picks the right control chart for you. No complicated decision trees!
Use This
Instead of This
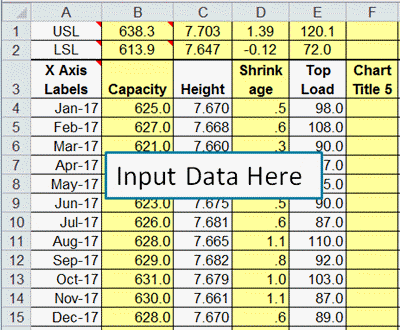
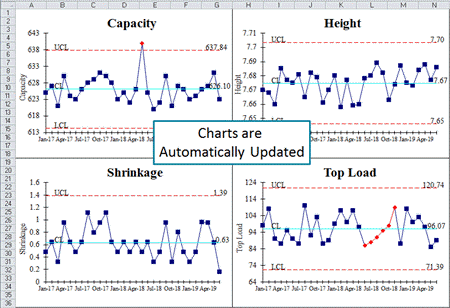
Control Chart Dashboards
Create and update control charts for dozens of metrics in a matter of minutes.
“When looking for a statistical software package to recommend to my clients and to use in my Six Sigma Green, Black and Master Black classes we found QI Macros for Excel to be the best over all value.”
- H. James Harrington
CEO, Harrington Institute
Six Sigma Tools: Control Charts, Pareto Charts, Histograms
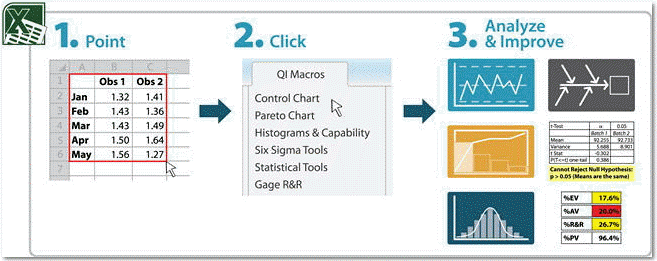
QI Macros for Excel creates over 40 Six Sigma and SPC charts and graphs with just a few clicks of the mouse including control charts, histograms, pareto charts, box whisker plots and more.
Six Sigma Tools Made Easy
Are you having trouble:
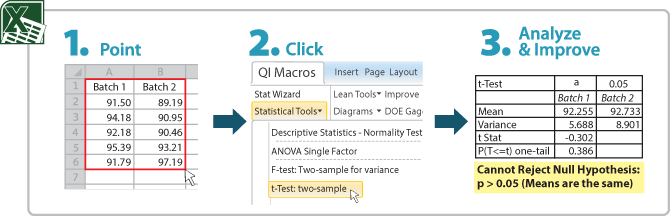
QI Macros Creates Six Sigma Tools in Three Easy Steps


QI Macros Statistical Analysis Tests
QI Macros Statistical tools simplify hypothesis testing and automatically interpret the results for you by answering the questions: "What does the p-value mean?" and "Are the means and variance the same or different?" It's like having a statistician at your side.
Statistical Software for Excel
Struggling with Statistics?
Don't Know Which Test to Run or How to Interpret the Results?
QI Macros Statistical Software Makes Stats as Easy as 1-2-3
QI Macros Lean Six Sigma Tools and Templates
QI Macros contains 100+ fill-in-the-blank templates and tools for all your Lean Six Sigma and SPC needs. Draw flowcharts and Ishikawa diagrams, use control chart dashboards to automate monthly reporting and perform advanced analysis like Gage R&R, DOE and so on.
Lean Six Sigma Tools and Templates
Affordable and Easy Lean Six Sigma Tools for Excel
Does it seem too hard to create all of the documentation for your Lean Six Sigma Project?
QI Macros Lean Six Sigma Tools for Excel simplify all of these tasks. QI Macros contains more than 30 Six Sigma and SPC Charts and more than 100 fill in the blank templates and tools for all your Lean Six Sigma needs.
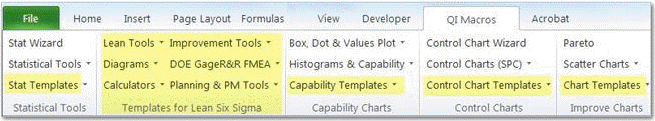
Lean Six Sigma Tools and Templates on the QI Macros Menu
QI Macros installs a new menu on your Excel toolbar. Control Chart, Capability Analysis and Statistical templates are organized with their corresponding macros. The Lean Six Sigma templates and tools are located together and organized by major category.
QI Macros Lean Six Sigma Tools Menu in Excel 2010-2019, Office 365:
To open a template, just click on the menu and then click on the tool you want. An Excel worksheet will open. To use templates like the Calculators, DOE, Gage R&R etc. just type or paste data into the yellow shaded input areas.
For Diagrams and Lean Tools like the Value Stream Map, use Excel's drawing toolbar to update the template and to insert boxes, arrows and other symbols.

QI Macros Wizards Automate Data Analysis
QI Macros Wizards contain built in code to analyze your data and determine the right chart or test to run:
• Data Mining Wizard to automate improvement project development
• Control Chart Wizard to choose the right control chart automatically.
• Chart Wizard to answer: "What chart should I choose?”
• Statistics Wizard to simplify hypothesis testing.
• PivotTable Wizard for data mining.

QI Macros Data Mining and Analysis Tools
QI Macros Data Mining and Analysis tools help you analyze and reorganize your data: Data Mining Wizard, PivotTable Wizard, Word Count, Stack and Restack, Paste Link/Paste Link Transpose and Box Cox Transformation.
“I am very pleased with your product. It does everything you said it would and the cost is an unbelievable value. Many thanks for developing such a useful tool!!!”
- Kate Felix, PhD, RN

SPC Software Comparison
Before you make a Lean Six Sigma software choice, take a look at the facts. Our customers tell us that QI Macros is less expensive, faster and easier to learn and use than our competitors and provides all the tools they will ever need.

© Copyright 2000-2023 COGITO SOFTWARE CO.,LTD. All rights reserved


