|
|
|
|
|
|
|
QI Macros Key Tools
QI Macros - The All in One Tool for Quality Professionals
SPC Charts - Lean Six Sigma Templates - Statistics - Data Mining
“I’ve been using your QI Macros for the last ten years and have always found them the best and lowest cost tool available. The other “stat” and charting programs are way too expensive and complex for most of the QA people that I’ve trained.”
- Steve Hoyt
ASQ Program Chair
QI Macros Add-In for Excel Installs a New Menu on Excel's Toolbar

Tools are Grouped in These Key Categories
Capability Charts
Histogram in Excel with Cp, Cpk
Tired of Trying to Make Histograms in Excel?
QI Macros Creates Excel Histograms in Three Easy Steps

What is a Histogram?
Histograms show the spread, or dispersion, of variable data. The customer's upper specification (USL) and lower specification limits (LSL) determine how well the process delivers on customer requirements. Measurements outside of the spec limits represent data points that don't meet customer requirements.
Please note: If you are asked by QI Macros for a "Subgroup Size," a subgroup is a group of measurements produced under the same set of conditions.
What is Cool about QI Macros Histogram Maker in Excel?

“I am very impressed with QI Macros Software. I work with Excel eight hours a day and thought that I had written macros that made me efficient. The Control Charting and Histogram macros in QI Macros alone have saved me hours of work and allowed me to present data to management in a format that is meaningful.”
- Kyle Dopp
First Choice Solutions
Why Choose QI Macros to Perform Capability Analysis and Draw Histograms?

Affordable

Easy to Use

Proven and Trusted
Process Capability Analysis in Excel
You Don't Have to be a Black Belt to Perform Capability Analysis
A capable process meets customer requirements 100% of the time. Customer requirements are defined using an upper specification limit (USL) and a lower specification limit (LSL). Think of these specification limits as goal posts.


|
Not Capable |
Capable |
|
|
|
|
|
|
Not Capable to Centered & Capable |
||
|
|
||

Process capability metrics are used to determine how well the output of a stable process meets these specifications:
|
||||||||||||||||||||
|---|---|---|---|---|---|---|---|---|---|---|---|---|---|---|---|---|---|---|---|---|
Cp vs Cpk Examples
|
Fits But Is Not Centered  |
|
Process improvement goal is to move the output closer to the target without increasing variation. |
|
Centered But Does Not Fit  |
|
Process improvement goal is to reduce variation so that the process fits between the spec limits. |
|
One-Sided Spec Limit  |
|
|
People confuse a "hard limit," (i.e. zero) for a "spec limit". |
|
|
One-Sided Spec Limit  |
|
|
If you enter an LSL of zero, Cpk uses CpkL which means Cpk < 1 because the mean is closer to zero. |
|
Capability Analysis Metrics Rules of Thumb
Box and Whisker Plot Maker in Excel
What is a Box Plot? How Can You Easily Create One in Excel?
Box and Whisker Plots (Box Plots or Boxplots) are like simple histograms turned on their side. Use them to analyze the variation between data sets or the variation within a dataset.

Box Plot Elements Explained

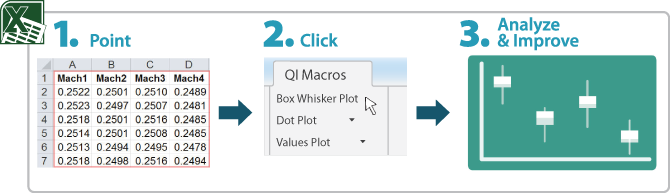
QI Macros Box Plot Generator Creates Plots in Three Easy Steps
Box and Whisker Plots are hard to create manually or in Excel. Use QI Macros to save time and get the calculations right.
Scatter Plot Maker in Excel
Easily Create Scatter Plots in Excel Using QI Macros

If R² is greater than .80, there is a strong relationship between the two data sets. R² close to 1.0 means a perfect fit.
Example of an Excel Scatter Plot Diagram Created by QI Macros

Scatterplot diagrams are used to evaluate the correlation or cause-effect relationship (if any) between two variables (e.g., speed and gas consumption in a vehicle).
When you think there's a cause-effect link between two indicators (e.g., calories consumed and weight gain) then you can use the scatter plot to prove or disprove it. If the points are tightly clustered along the trend line, then there's probably a strong correlation. If it looks more like a shotgun blast, there is no correlation.
Scatter Diagram with Strong Correlation

Scatter Diagram with No Correlation

Scatter Plot Diagrams can be made manually or in Excel. However, you have to find the right chart to get a trend line and Excel will not calculate the R² correlation of determination (square of the correlation coefficient) for you.
Use a Scatter Plot Maker like QI Macros for Excel to save time and get the calculations right.
Compatible with Excel 2010-2019/Office 365 (PC) | 2016, 2019/Office 365 (Mac)
You can also switch the order of the X and Y axis!
In the Scatter Template, once you have created your chart, you can switch the X and Y-Axis by inputting "1" or "2" in the "Order" section to the right of your chart. Once you have typed in 1 or 2, press Enter and your Chart will update automatically:

Want to create an XY Scatter Diagram with Four Quadrants? See instructions below:
Although QI Macros does not offer this specific diagram, you can create one with the combination of our software and Excel's functionality.
1.) Create your Scatter Diagram:

2.) Next, delete the trend line from your diagram:

3.) Once the diagram has been created, right-click on your X-Axis, and select "Format Axis":

4.) Next, update your Axis Value which will place the X-Axis in the middle of your diagram, depending on the value you choose:

5.) Then, right-click on your Y-Axis, and select "Format Axis":

6.) Update your Axis Value which will place the Y-Axis in the middle of your diagram, depending on the value you choose:
7.) Once you have updated both the X and Y Axis Values, you have now created an XY Scatter Diagram with Four Quadrants!

Control Charts
Create a Control Chart in Seconds
What is a Control Chart?
Control Charts Evaluate Process Performance Over Time
A control chart is a smart line graph. It performs calculations on your data and displays:
Control Charts Contain These Key Elements

As data moves through the zones created by these control limits, a control chart highlights data points or trends that should be investigated.
Three Reasons You Need Software to Create a Control Chart

Control Chart Types
There are seven Shewhart control charts and many more for special situations.
Each type of control chart has a different formula for calculating control limits.
Stability rules identify and highlight points or trends that need to be investigated. They vary by industry.
Fourth Reason:
QI Macros control chart software is affordable and easy to use.
Here is a Control Chart Created Using QI Macros Add-in for Excel

Cusum Chart in Excel
Cumulative Sum Charts Can Detect Small Shifts in a Process
Cusum charts can detect process shifts more rapidly than the XmR or XbarR. If a trend develops, it's evidence that the process has shifted.
A Cusum Chart consists of:
Cusum Chart Example Created by QI Macros for Excel
WMA Chart in Excel
Use the EWMA Chart when you have one sample and want to detect small shifts in performance.
The EWMA (exponentially weighted moving average) chart's performance is similar to the Cusum chart.
Example of an EWMA Chart created in QI Macros for Excel

To create an EWMA control chart using QI Macros:

Levey Jennings Control Chart
It's Easy to Create a Levey Jennings Chart in Excel
Healthcare labs use the Levey Jennings charts to monitor key measures of health like cholesterol and glucose. The Levey Jennings chart, unlike other control charts, use standard deviation for control limits.
Example of a Levey Jennings Control Chart Created by QI Macros Add-in

QI Macros Add-in for Excel Offers Several Ways to Create a Levey Jennings Chart
To create a Levey Jennings chart using one of the macros:

Other Charts
Pareto Charts are a great tool but they can be difficult to create.
“I really like the QI Macros. The Pareto chart alone is worth the purchase price.”
- Mike Dean, Ellwood Texas Forge
What Makes an Authentic Pareto Chart?
Paretos combine a sorted bar graph with a cumulative line graph.
Pareto charts are used in Six Sigma and other process improvement methodologies to determine where to focus your efforts.
Pareto analysis is based on the principle that one or two "big bars" represent the bulk of any problem. This is known as Pareto's Rule or the 80/20 rule.

Special Features That Make QI Macros Pareto Charts Unique
Shaded and "Other" Bar
Bars over 20% are highlighted.

"Other Bar" groups small categories

Draw Pareto from Raw Data
Data not subtotaled? No problem.
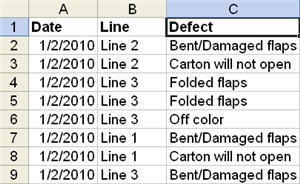
QI Macros counts each phrase and draws a Pareto chart in one step.
Fishbone Diagram Template in Excel
Tired of Trying to Draw Fishbone Diagrams Manually?
QI Macros Automated Template Draws Ishikawa Fishbone Diagrams in Seconds
Open the Template & Input Your Text

Click Create Fishbone

Your Fishbone Will Appear in Seconds

“QI Macros is a fantastic tool. It allows me to do things that once took 30-60 minutes down to 2-3 minutes. It's also very user-friendly and easy to operate.”
- Wade Johnson, Carlson Craft Business Solutions
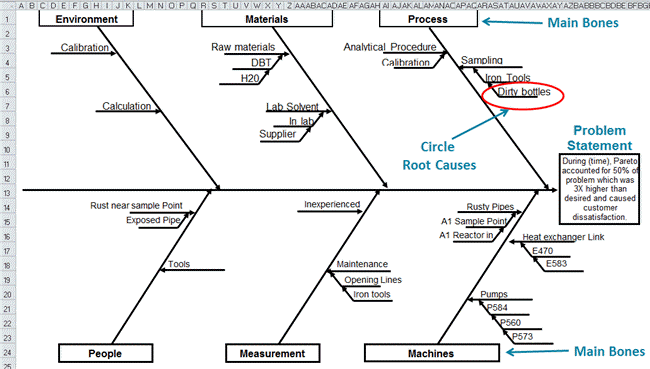
Here's a Larger View of the Fishbone Diagram that QI Macros Creates
Updating and Sharing Your Fishbone is Just as Easy!
To revise the Fishbone: go back to the input tab and update your text, then click "Create Fishbone" again.
To copy and share your fishbone to Powerpoint or Word: Click on the "Copy" button, then paste the fishbone diagram as either a picture or drawing object. Pictures are static. Drawing objects can be revised.

To check the logic in your fishbone, click on the Check 5 Whys Logic button.

Run Chart in Excel
Run Charts Consist of a Line Graph and Center Line
The center line is calculated from the data and can represent either the average or median.

Run charts are an improvement over the ancient line graph. But they aren't cutting edge or state of the art like control charts.
Fortunately, using QI Macros for Excel, its just as easy to draw a control chart as it is a line graph or run chart.
Run Charts vs Control Charts
Run Chart

A run chart adds a center line which represents the average or the median of the data.
Control Chart

A control chart is a smart chart. It calculates a center line and sigma lines. It analyzes the data and identifies unstable points and trends.
Just select your data and select Run Charts from the QI Macros menu. Then choose whether you want the center line to be the average or median of your data. Or select the Control Chart wizard and draw a control chart to perform a more complete analysis on your data.
Do You Struggle Running Excel Charts?
How About Advanced Charts Like Histograms and Paretos?
You are not alone. While Excel creates basic charts, the multi-step process takes a long time and the resulting chart is often hard to read, suffering from what Edward Tufte calls "Chartjunk." We believe that charting software should do as much of the work as possible. That’s why we created QI Macros for Excel — a shortcut to Excel Charts.
QI Macros Add-in Makes It Easy to Draw Standard Charts in Excel
But More Importantly...QI Macros Draws Smart Charts
Compatible with Excel 2010-2019/Office 365 (PC) | 2016, 2019/Office 365 (Mac)


© Copyright 2000-2025 COGITO SOFTWARE CO.,LTD. All rights reserved


