|
|
|
|
|
|
|

Designer and Preview
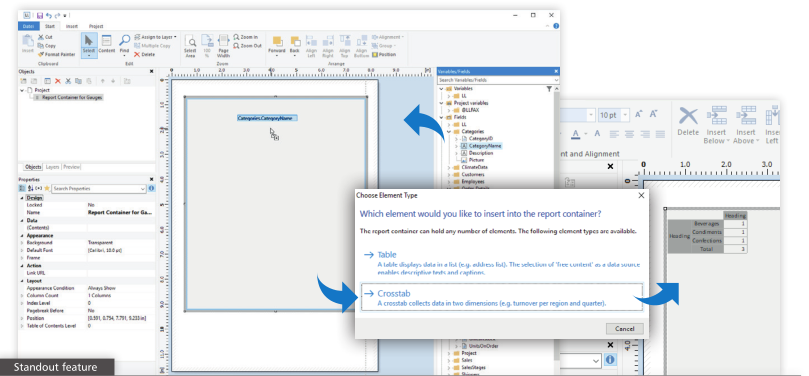
Creating a Crosstab via Drag and Drop
You can now create both tables and crosstabs simply by drag- ging fields to your workspace. This is a very intuitive way to
build a basic crosstab that you can edit later. This way, you start quickly and enhance the crosstab step by step
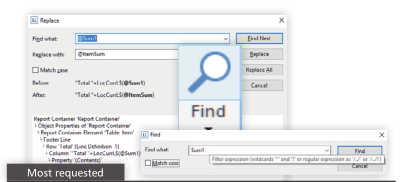
Find and Replace
The Designer now provides a powerful find and replace function. It lets you quickly and easily update reports to reflect changes to the names of fields, tables, variables, etc.
Seamless Refresh for Preview
E.g. for drilldown and other interactive preview features, the preview is now seamlessly refreshed when new content has been generated.
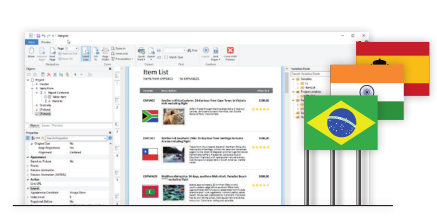
Country Flags
The new CountryFlag function enables you to create an SVG graphic of the required country flag anywhere in your report.
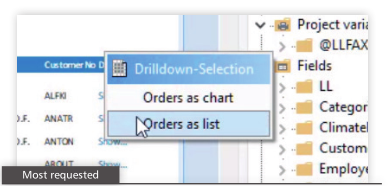
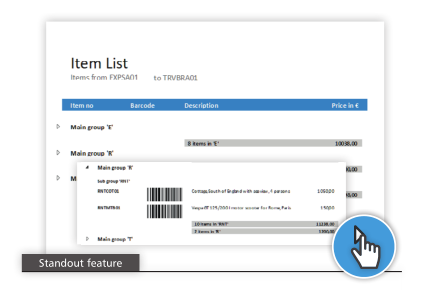
Expandable Regions for Groups
You can intuitively drilldown within grouped lists by expanding and collapsing selected regions. If your application supports real data preview and drilldown, this feature is available in the preview and in the HTML5 viewer. The components included with List & Label support this function out of the box.
the Backbone of Your Application
Embedded Export Formats
Export Formats can be embedded in preview files for later export to Microsoft Excel and Word, MHTML and XHTML – in addition to PDF and the graphics formats that LL already offers. Your application must support drilldown; the components included with List & Label already support this feature. It lets your users open the preview file in the free List & Label viewer and export to the specified formats.

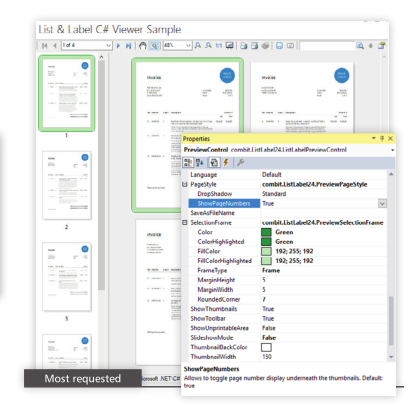
Preview Tailored to Your Application
A variety of settings allow you to tailor the preview to your appli- cation’s look & feel. You can change the colors and shading, plus the selection frame and how page numbers are displayed.
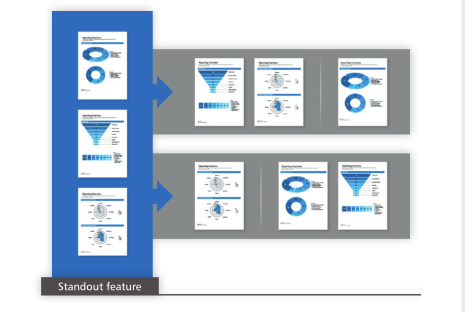
Create Preview From Individual Pages
Break down the preview into your preferred page ranges. You can then recombine the resulting individual files in any order, giving you entirely new ways to restructure an existing report on the fly.
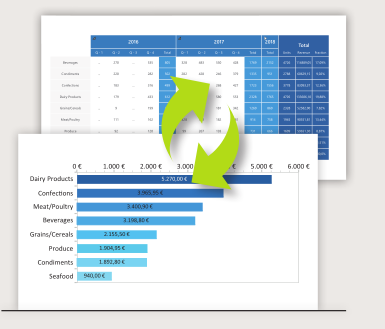
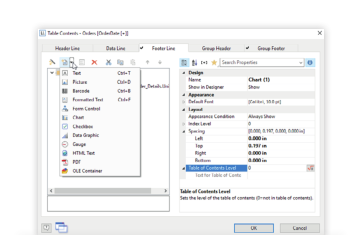
Easily Converting Crosstabs to Charts and Vice Versa
In terms of underlying data, crosstabs and charts have much in common. In reports, a chart is often included with a crosstab to visualize the data. This can now be perfor- med directly from within the object window or ribbon. It is also possible to convert charts into crosstabs.
Web & .NET
Parametrized Data Sources
Thanks to parametrized data sources, List & Label’s power- ful filtering options can now be used anywhere. This feature lets you combine data-source parameters with actual report
parameters in the Designer. As a result, the parameters of your stored procedure, for example, can be employed as report parameters. The feature is also available for REST and JSON in the Report Server.

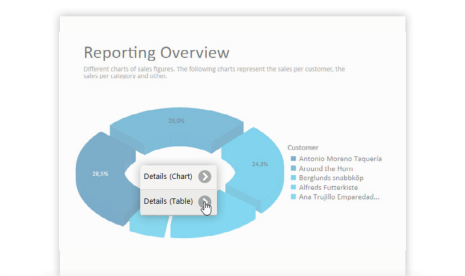
Drilldown Support in the HTML5 Viewer
Drilldown in charts has long been possible in desktop applications. Now we have introduced this functionality to Web reporting.
Active link areas can be added to chart segments, and you simply click to access the underlying data.
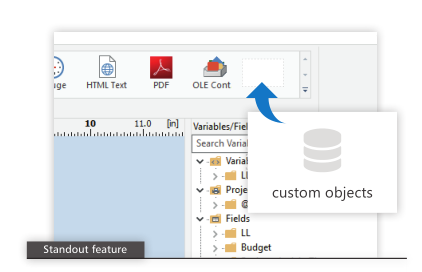
Web Designer: Custom Objects/Functions
Add your custom Designer functions and Designer objects to the Web Designer configuration on the server. They are then avail- able to clients (also possible for the Report Server). This means the Web Designer– just like our classic Desktop Designer – can be extended in line with your needs.
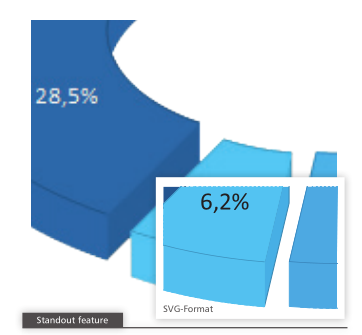
SVG-Format Charts in the HTML5 Viewer
In browsers and when exporting to XHTML, all charts, shape- files (e.g. for geovisualization) and barcodes are now rendered in SVG format. This means that despite small file sizes, image quality is excellent, even when zoomed.
Report Server
(Enterprise Edition)
New Actions for Scheduled Reports
In addition to distribution by email, via FTP or Microsoft Share- Point, scheduled reports can now be uploaded to Google Drive, Dropbox, or Microsoft OneDrive.

Native Apps for iOS and Android
The new Report Server apps (to be available from App Store resp. Play Store) let you access key Report Server functions natively on almost any mobile device. The app loads faster than the complete browser-based user interface, and uses very little bandwidth. We currently support Android, iOS and Windows.

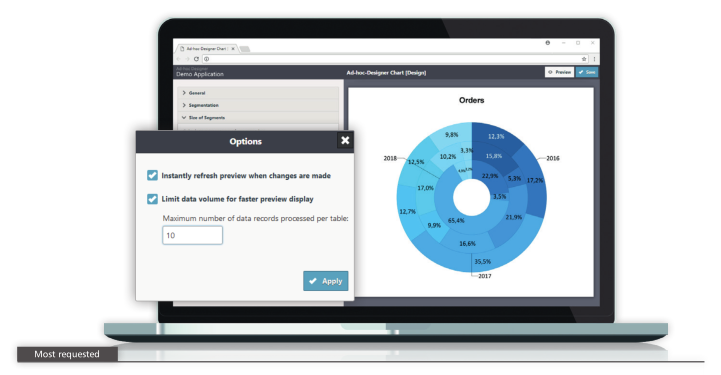
Requested Features in the Ad-hoc Designer
Select “Instantly refresh preview when changes are made” to update the preview as soon as the layout has been modified.
For rapid preview generation with extensive data sources, you can now restrict the quantity of data by selecting “Limit data volume for faster preview display”.
Another improvement: you can now select your preferred format for the output date.
Other New Features
Enhanced Performance
We have again succeeded in boosting List & Label’s processing speed significantly. In list projects, you benefit from 20% higher speeds on average, regardless of the data source or develop- ment environment. Even greater performance improvements are
achievable with ADO .NET when large numbers of 1:1 relations are employed.

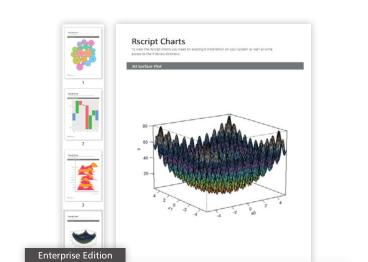
Rscript for Additional Charts
List & Label already offers a wide variety of charts. But data can be represented in countless ways, and we have connected
Rscript to List & Label to give you even greater choice. Rscript is an established language for statistical computing and graphics that supports visualization of virtually any kind. This extends List & Label’s existing report-layout and data-access options to inclu- de the huge range of charts and graphics provided by Rscript.

Animations for XHTML Export
We have added an HTML animation property to most objects. You can now animate objects displayed in the browser in a simil- ar way to that possible in the preview window. Simply select one of the nine available animation types and specify the delay and duration. This feature is also available in the Report Server.
Nested Tables
Nested tables are now supported in group headers and header lines. You can include data in group headers quickly and easily from a sub-table. In header lines, this feature is limited to static content.
Further Features
NULL Values
You can now specify whether a null value should be treated as a zero, ignored, or whether it should cause a gap to be left, e.g. in a line chart.
Change to Mouse Wheel Zoom Behavior
When a user zooms with the mouse wheel, the enlarged region is centered around the cursor position, making it easier to home in on a particular detail.
Support for Additional PDF/A Modes
List & Label now supports not only PDF/A-1a mode but also PDF/A-1b mode. This is simpler and provides a basic level of compliance with the related standard. Further- more, PDF/A-3b is available for embedding files of any type in a PDF document.
Keyboard Navigation in the Formula Dialog
Keyboard navigation in the formula dialog has been revi- sed, making the dialog easy to use without a mouse.
Supports Windows 10
Codename Redstone 5

© Copyright 2000-2023 COGITO SOFTWARE CO.,LTD. All rights reserved


