010-68421378
sales@cogitosoft.com
Categories
AddFlow  AmCharts JavaScript Stock Chart AmCharts 4: Charts Aspose.Total for Java Altova SchemaAgent Altova DatabaseSpy Altova MobileTogether Altova UModel  Altova MapForce Altova StyleVision Server Altova MapForce Server Altova Authentic Aspose.Total for .NET Altova RaptorXML Server ComponentOne Ultimate Chart FX for SharePoint Chart FX CodeCharge Studio ComponentOne Enterprise combit Report Server Combit List & Label 22 Controls for Visual C++ MFC Chart Pro for Visual C ++ MFC DbVisualizer version 12.1 DemoCharge DXperience Subscription .NET DevExpress Universal Subscription Essential Studio for ASP.NET MVC FusionCharts Suite XT FusionCharts for Flex  FusionExport V2.0 GrapeCity TX Text Control .NET for WPF GrapeCity Spread Studio Highcharts Gantt Highcharts 10.0 版 HelpNDoc Infragistics Ultimate  ImageKit9 ActiveX ImageKit.NET JetBrains--Fleet JetBrains-DataSpell JetBrains--DataGrip jQuery EasyUI jChart FX Plus Nevron Vision for .NET OPC DA .NET Server Toolkit  OSS ASN.1/C Oxygen XML Author  OSS 4G NAS/C, C++ Encoder Decoder Library OSS ASN.1 Tools for C with 4G S1/X2 OSS ASN.1/C# OSS ASN.1/JAVA OSS ASN.1/C++ OPC HDA .NET Server Toolkit OPC DA .Net Client Development Component PowerBuilder redgate NET Developer Bundle Report Control for Visual C++ MFC  Altova StyleVision Sencha Test Stimulsoft Reports.PHP Stimulsoft Reports.JS Stimulsoft Reports.Java Stimulsoft Reports. Ultimate Stimulsoft Reports.Wpf Stimulsoft Reports.Silverlight SPC Control Chart Tools for .Net SlickEdit Source Insight Software Verify .Net Coverage Validator Toolkit Pro for VisualC++MFC TeeChart .NET Telerik DevCraft Complete Altova XMLSpy Zend Server

ApexSQL VM Monitor


ApexSQL VM Monitor

Virtualization performance monitoring

We are excited to announce the release of a new monitoring tool, ApexSQL VM Monitor. ApexSQL VM Monitor is a web application for comprehensive monitoring and troubleshooting of virtual environments.

ApexSQL VM Monitor comes with support for Hyper-V and VMware hypervisor performance monitoring along with the performance monitoring of virtual machines hosted on those hypervisors. Additionally, ApexSQL VM Monitor provides features for troubleshooting of virtual environment performance, such as reviewing historical data, alerting and reporting.

Monitor, detect, alert on and solve virtualization performance problems

Overview

Monitor multiple hypervisors - Hyper-V and ESXi

View system performance metrics of monitored hosts

Monitor virtual machines performance

Monitor performance of host devices

Use comprehensive dashboards for viewing metrics

Calculate baselines and thresholds

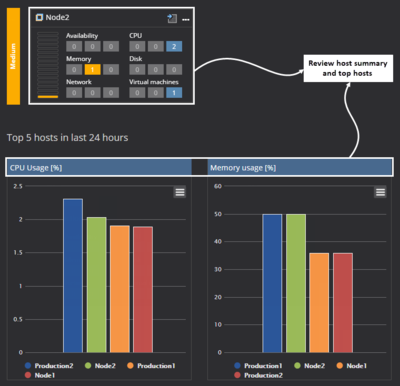
View top 5 loaded virtual machines for specific hosts

Create and export comprehensive performance reports

Features


Host informationsummary

Check information and alert summary forone, some, or all hosts in the group dashboard


Hypervisorinformation summary

Check information and alert summary forspecific hypervisors – Hyper-V or VMware ESXi


Host dashboard

Quickly review basic information andhealth for monitored hosts. Easily drill down to review metrics and alertdetails


Top 5 VMs perhost

Quickly check top 5 slowest virtualmachines for selected hosts directly on the host dashboard


CPU performance

Easily analyze performance of each CPUfor specific hosts


Memoryperformance

Check memory performance and additionaldetails about memory amount and average usage for specific hosts


Disk performance

Easily monitor disk performance of allhost disks


Networkperformance

Monitor performanceof all network cards installed on single hos


Virtual machinedashboard

Easily monitor and analyze virtualmachines performance


Panel basedapplication dashboard

Check critical CPU and memoryinformation as well as alert summary for one, some, or all hosts in the groupdashboard


Themes

Choose between dark and light-coloredlayouts

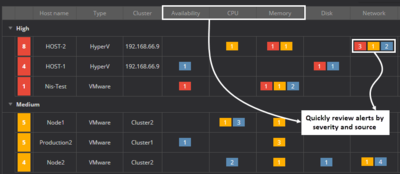
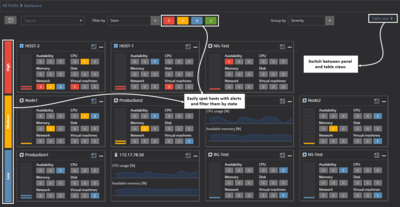
The ApexSQL VM Monitor unified dashboard help to quickly identify hosts with performance issues.

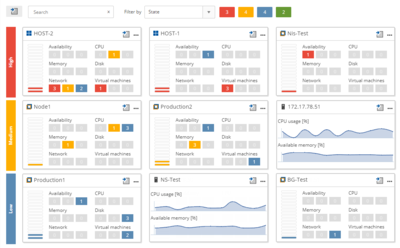
Besides the regular table view, a centralized dashboard has the panel view to find most problematic hosts easily and to check the state of monitored hosts quickly.

ApexSQL VM Monitor has themed interface with two color schemes – Light and Dark.

ApexSQL VM Monitor uses dashboards for both supported hypervisors – Hyper-V and VMware. Hypervisor dashboards, besides state and alerts info, provide information about top 5 slowest hosts by various performance metrics like CPU usage, Available memory, Network utilization and Disk free space.

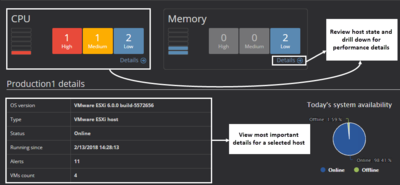
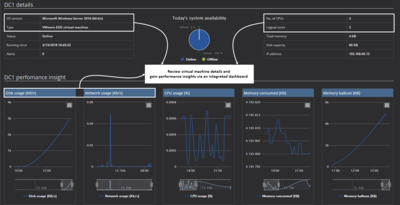
The host dashboard displays specific details for selected host machines such as information about alerts and hardware for the chosen host machine. Information about hosted virtual machines provides crucial performance details and alert states.

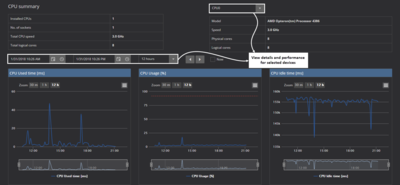
Performance charts allow the historical view of the collected data for performance counters. Each hardware category has its selection of performance charts with additional hardware details for selected performance type – CPU, Memory, Disk or Network.

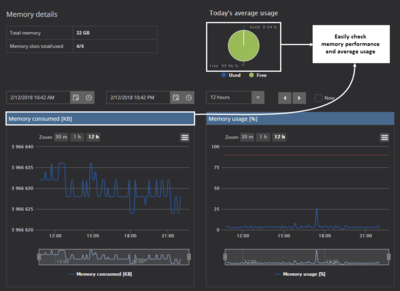
The memory performance page displays information about memory amount and average usage.

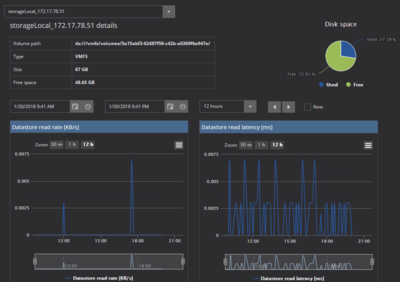
The disk performance page contains information about different disks/data stores along with performance charts for the corresponding data store or disk.

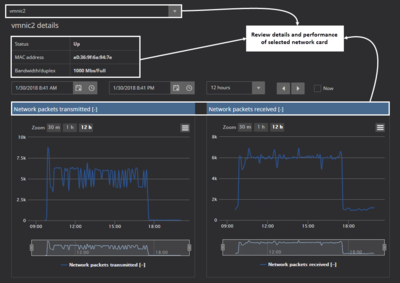
The network performance page has details for individual network cards and belonging performance charts.

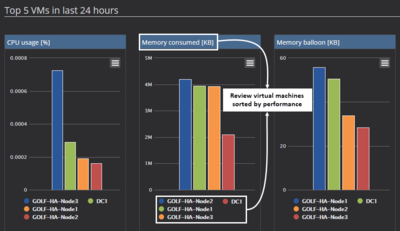
The Virtual machine dashboard uses additional charts to ensure a quick insight into the performance of the selected virtual machine for most important performance metrics.

 
Quick Navigation;

© Copyright 2000-2023  COGITO SOFTWARE CO.,LTD. All rights reserved