IE Web Developer V2
Webpage Inspector, Script Console, Logging messages and HTTP Monitor...
Current Version 2.4.2
IE WebDeveloper is an add-on for Microsoft Internet Explorer. The rich web debugging toolset allows you to inspect and edit the live HTML DOM and current cascaded styles, evaluate expressions and display error messages, log messages, explore source code of webpage and monitor DHTML Event and HTTP Traffic.
Integrated Web Debugging Tools.
• Webpage Inspector-View, traverse, and even dynamically update that HTML DOM and Current Style directly in the browser window. Analyze the web pages you are interested in and learn their tricks.
• Script Console-Use the JavaScript console to evaluate expressions, display error messages and locate the source code which causes the error.
• Logging for web pages, you can log messages from JavaScript in your web page directly to script console. which can be used on same interface as Firebug(console.log, console.debug, and so on...)
• Source Explorer-View and explore all HTML, CSS and JavaScript source code of the current webpage. It gives you a centralized view of the functions, variables used in JavaScript source code.
• Event Log-Use the event log console to record the triggered event of WebBrowser, HTMLDocument, HTMLWindow and selected HTML Element.
• HTTP Monitor-The lite edition of our IE HTTP Analyzer allow you to monitor HTTP/HTTPS traffic, know exactly what and when are sent and received from web application.
Debugger feature
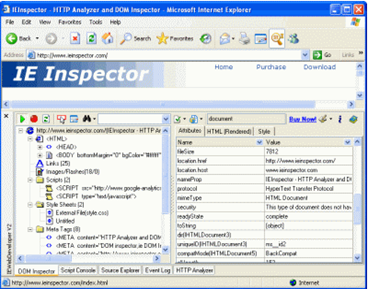
• Tree-like HTML Structure view-The tree view show the wide range structure information of the web page. It displays details on forms, meta tags, links, images, scripts, style sheets, applets, xml data islands and Applets/ActiveX objects
• HTML DOM-View, traverse, and even dynamically update that HTML DOM directly in the browser window.
• Style Sheet-Enables you to trace various style sheets, such as linked style sheets, embedded style sheets, and imported style sheets and in-line style rules. View current style of any web document and highlight all style attributes with non-default values.
• Inspect HTML DOM Element-Inspect HTML DOM element and get the full name of HTML DOM Node by clicking on webpage. Search for particular elements by ID/Name, tag name /class, or attributes Text.
• Various inspector-DOM Node,Document,Form,Links, Frames...
• Validate Webpage-Online validate W3C HTML, HTML Tidy, CSS, Feed, Links, WAI, Section 508 and P3P. Local validate W3C HTML and CSS.
• Various online website tools-Whois lookup, Ping, Trace route, DNS and My IP information service by domaintools.com, Website details by alexa.com, Webpage speed report by websiteoptimization.com, webpage speed test by webscale.com , web archive history by web.archive.org and search engine checker by sitesolution.com
• View HTML Source-View HTML origin source and rendered source.
Script Console
• Command line-Use the JavaScript console to evaluate expressions, get HTML DOM, assign values to variables, test comparison operators, and perform math operations.
• Display error messages-When a JavaScript error condition is encountered in the web browser, the detail information of script error will be recorded into script console. Use the console, you can locate to the error line of source code which causes the error.
• Run multi-line Script-In addition to using command line to evaluate one-line JavaScript code, you can use the "Run Script" dialog to execute multi-line script at one time.
• Logging for web pages, you can log messages from JavaScript in your web page directly to script console. which can be used on same interface as Firebug (console.log, console.debug, and so on...)
• Export log messages, You can export log messages to various file formats. (excel, xml, html and text)
Source Explorer
• View Source code-View all HTML, CSS and JavaScript source code of the current webpage with a syntax highlighting editor.
• JavaScript Code Explorer-The code explorer tree gives you a centralized view of the functions, variables used in JavaScript source code.
• View All JavaScript in one file-The current web page may contain many JavaScript files and HTML files. The handy function extracts all JavaScript source code from these files into one file and shows it in the editor.
• View CSS Text in one file-The handy function extract CSS text from the HTML files and CSS files into one file and shows it in the editor.
• Method List-The method list enables you to view a list of methods in the current unit and quickly jump to the implementation of a given method.
• HTML, JavaScript, CSS, VBS, XML syntax highlighting.
• Line numbering, Gutter, Margin.
• bookmarks.
Event Log
• Event Log console-Use the event log console to record the triggered event of WebBrowser, HTMLDocument, HTMLWindow and selected HTML Element.
• Event Filter-Filter unwanted event types and store these filter conditions.
HTTP Monitor
Please be noted, HTTP Monitor has only basic feature of our HTTP Analyzer, if you need an advanced HTTP Analyzer. Please go to this URL.
• Support HTTPS-show you unencrypted data sent over HTTPS / SSL connections.
• Hex Viewer allow users to view and edit binary files in hexadecimal and textual format.
• Compare requests by selecting two requests.
• Organize-HTTP/HTTPS Information into sessions for easy identification of requests and responses.
• Selectively clear caches and cookies which are related with HTTP/HTTPS sessions
• Instant help-on HTTP status code
Grid (All grids used in IE WebDeveloper)
• MS Excel® style data filtering, customize filter criteria against any data item
• Automatic click-sorting against an unlimited number of columns, descending or ascending
• Automatic data grouping - an extremely powerful data viewing and manipulation metaphor
• Automatic runtime column selection - easily customize the columns visible on-screen with intuitive drag and drop
• Export Grid to XML, MS Excel®, HTML, Text