|
|
|
|
|
|
|
Your sample size and power wizard.
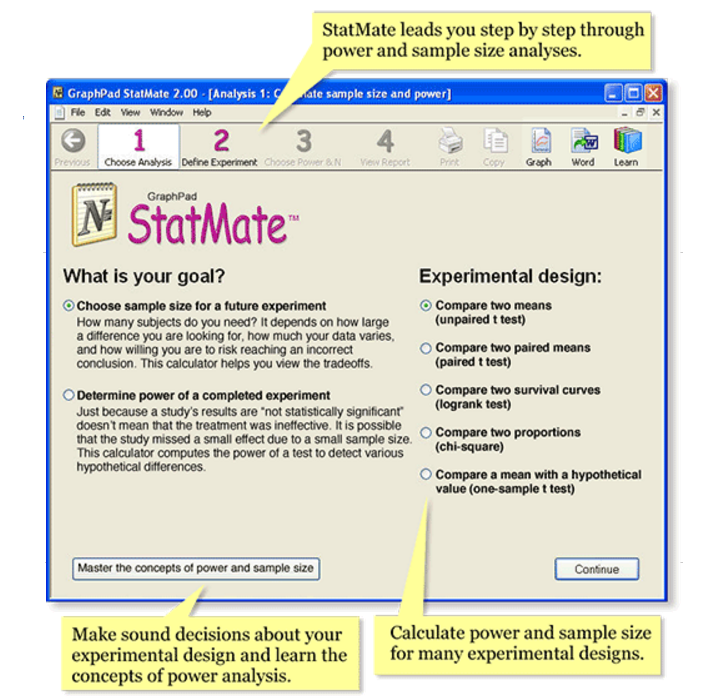
GraphPad StatMate takes the guesswork out of evaluating how many data points you'll need for an experiment, and makes it easy for you to quickly calculate the power of an experiment to detect various hypothetical differences. Its wizard-based format leads you through the necessary steps to determine the tradeoffs in terms of risks and costs. There is no learning curve with StatMate because it is self-explanatory. All the documentation you need is built right into the program.

Why Choose StatMate?
Why sample size matters
Many experiments and clinical trials are run with too few subjects. An underpowered study is wasted effort if even substantial treatment effects go undetected. When planning a study, therefore, you need to choose an appropriate sample size. Your decision depends upon a number of factors including, how scattered you expect your data to be, how willing you are to risk mistakenly finding a difference by chance, and how sure you must be that your study will detect a difference, if it exists.
StatMate shows you the tradeoffs
Some programs ask how much statistical power you desire and how large an effect you are looking for and then tell you what sample size you should use. The problem with this approach is that often you can't really know this in advance. You want to design a study with very high power to detect very small effects and with a very strict definition of statistical significance. But doing so requires lots of subjects, more than you can afford. StatMate 2 shows you the possibilities and helps you to understand the tradeoffs in terms of risk and cost so you can make sound sample-size and power decisions.
What about power?
You also need to know if your completed experiments have enough power. If an analysis results in a "statistically significant" conclusion, it's pretty easy to interpret. But interpreting "not statistically significant" results is more difficult. Its never possible to prove that a treatment had zero effect, because tiny differences may go undetected. StatMate shows you the power of your experiment to detect various hypothetical differences.
StatMate features
Calculate sample size – How many subjects (data points) do you need? Naturally, the answer is "it depends". It depends on how large a difference you are looking for, how much your data vary, and on how willing you are to risk mistakenly finding a difference by chance or mistakenly missing a real difference. StatMate helps you see the tradeoffs, so you can pick an appropriate sample size for your experiment.
Calculate power – Just because a study reaches a conclusion that the results are "not statistically significant" doesn't mean that the treatment was ineffective. It is possible that the study missed a small effect due to small sample size and/or large scatter. StatMate calculates the power of a test to detect various hypothetical differences.
Choose from these experimental designs:
Compare two means (unpaired t test)
Compare two paired means (paired t test)
Compare two survival curves (logrank test)
Compare two proportions (chi-square test)
Compare a mean with a hypothetical value (one-sample t test)
StatMate is available for both Windows and Mac!
System requirements Windows: Windows 98 and up and 2 MB of free space. Macintosh: OS 9 (contact us for a special installer) or OSX 10.3 (Panther) to 10.6 (Snow Leopard). StatMate requires only 4Mb free hard disk space. StatMate will not run under OSX 10.7 (Lion).
GraphPad Prism's official website: http://www.graphpad-prism.cn/

© Copyright 2000-2025 COGITO SOFTWARE CO.,LTD. All rights reserved


