NoSQLBooster 5.0 Is Now Available!
We’re happy to mark another significant milestone for the NoSQLBooster for MongoDB with the final release of the 5.0. It brings a number of new features to increase MongoDB’ers productivity, comprehensive server monitoring and diagnostics tools, visual explain plan, MongoDB log parser, enhanced SQL Query to support SQL JOIN and uncorrelated sub-queries, more friendly display of object and array values, One-click Group-By, better code snippets, mark changed lines and NoSQLBooster-enabled live tutorials…
The product will automatically enter the 30-day trial mode after successful installation. At the end of the 30-day trial period, the product becomes a free edition. The free edition is free for personal/commercial use but with limited functions.
The following figure shows the main interface of version 5.0.
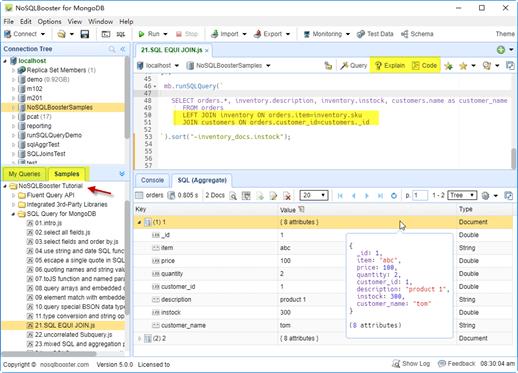
Main interface
Let’s dive in and get an overview of what’s coming in NoSQLBooster 5.0!
Although we are showing screenshots of NoSQLBooster for Windows, all these new features are available for Mac OS X and Linux as well.
What’s new?
“My Queries/Samples” pane
In version 5.0, the most significant change in the UI interface was the addition of “My Queries / Samples” Pane. The “My Queries / Samples” pane has two tabs, “My Queries” and “Samples.”
The “My Queries” tab is used to open user-saved query scripts quickly. By default, the user-saved query script is saved as a “connection -> database -> query name” directory structure. Double-click to open a saved query script will automatically connect to the appropriate database server and switches to the appropriate database.
The “Sample” tab includes several NoSQLBooster-Enabled tutorials. All samples are executable in NoSQLBooster already, with detailed descriptions. You can try these queries and change them to learn better.
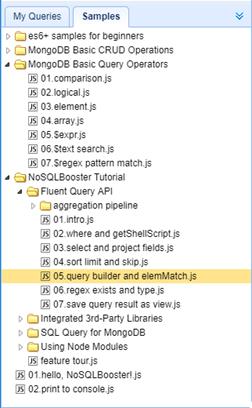
Samples tab
Visual explain plan
NoSQLBooster’s Visual Explain transforms explain output into a hierarchical view of the query plan, which is significantly easier to read and understand, allowing for query tuning to enhance query and resolve performance issues.
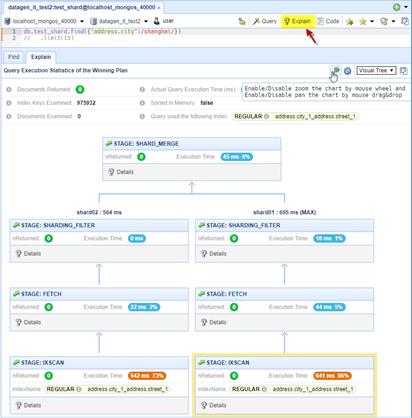
Visual explain
SQL joins and uncorrelated sub-queries
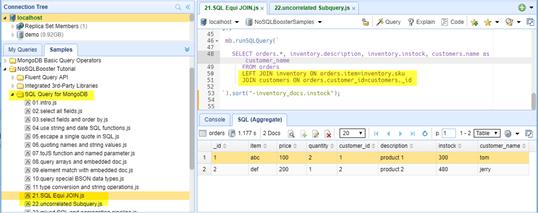
MongoDB 3.2 introduced the new $lookup operator. The $lookup operator added to the aggregation pipeline is essentially identical to a left outer SQL join. MongoDB 3.6 further enhances the capabilities of the $lookup operator to perform uncorrelated sub-queries between two collections as well as allow other join conditions besides a single equality match. NoSQLBooster 5.0 implements SQL Equi join and unrelated queries with the power of the $lookup operator.
NoSQLBooster supports INNER JOIN and LEFT JOIN, OUTER JOIN is not supported.
It should be mentioned that there is a tutorial on NoSQLBooster SQL Query for MongoDB in the lower left “Samples” pane. With this tutorial, you can learn and understand how to use NoSQLBooster SQL Query for MongoDB. Better yet, all SQL Functions provide the appropriate code snippets and mouse hover information and support code completion.
SQL Equi join
Monitoring tools
In version 5.0, we add several server monitoring and diagnostics tools and consolidate all monitoring related work into a drop-down menu called “Monitoring.”
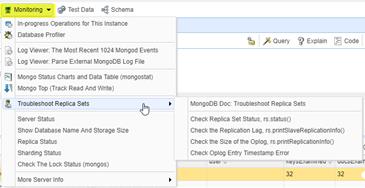
Monitoring drop menu
In-progress operations viewer
When your MongoDB is unresponsive, you need to determine the cause quickly. Although there can be many causes for server unresponsiveness, we sometimes find that exceptionally long running operations and/or blocking operations are the culprits. The new “In-progress operations” tool integrates the currentOp() and killOp() commands and allows you to find and kill long running MongoDB operations quickly.
The db.currentOp() command reports in-progress operations for the mongod instance.
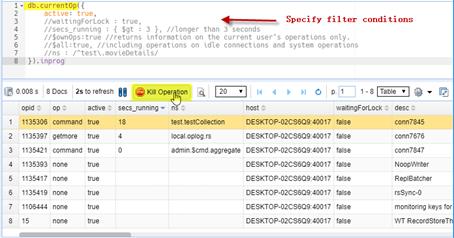
In-progress operations viewer
MongoDB log parser
This feature includes two MongoDB log viewers, one for parsing and displaying the most recent 1024 logged MongoD events, and the other for parsing and displaying external MongoDB log files. This tool will parse the log quickly and output general information about its contents, including timestamp, severity, component, context and command specific messages. It also allows you to save parsed log entries to MongoDB’s collection so that you can further analyze and query the logs using MongoDB’s find method.
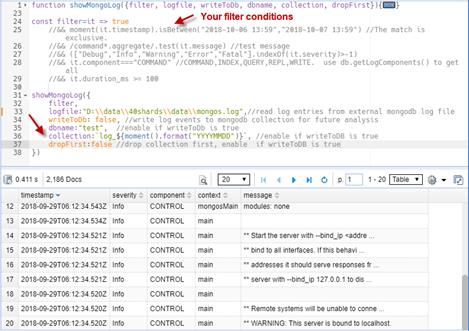
MongoDB log parser
Database profiler
This simple feature will display the database profiler logs information about database operations in “system.profile” collection. The profiler is off by default. You can enable the profiler on a per-database or per-instance basis at one of several profiling levels. By default, the slow operation threshold is 100 milliseconds.
Troubleshoot replica sets
This feature is a partial implementation of each of the functions mentioned in this official document for MongoDB - Troubleshoot Replica Sets.
It includes the following small features.
© Copyright 2000-2025 COGITO SOFTWARE CO.,LTD. All rights reserved