LightningChart
Finnish high-performance chart controls - free trial and technical support
Chart control for many technical R & D personnel, engineering designers is certainly no stranger, but the market has a large number of graphical control products, a single function, performance is not stable, it is difficult to meet the needs of different groups of people on different occasions. To this end, dedicated to the development of high-performance and state-of-the-art data visualization tool company Arction gives the perfect solution.
Arction was founded in 2007 as a control development company headquartered in Kuopio, Finland. Its products have been favored by NET developers since its inception. Arction has made great achievements in reshaping chart controls. For example, in 2009, Arction became the industry's first manufacturer of DirectX 2D rendering in the field of WinForms chart controls. In 2013, Arction was known as the first manufacturer to use TrueX to introduce true hardware acceleration for the WPF graphics industry The In recent years, Arction has focused on developing high-performance and state-of-the-art data visualization tools, setting the industry's highest standards.
Reporter noted that Arction introduced the market's highest performance control - LightningChart, really play a GPU acceleration and performance optimization of the biggest effect, it can be real-time rendering more than 1 billion data points of the huge data. At present, the product is widely used in scientific research, engineering, medical, trade, finance, and many other areas of real-time measurement and analysis applications, and so large data visualization. In addition, as the industry's fastest, most advanced graphical controls, LightningChart supports WPF and WinForms platforms. It has a high degree of flexibility and technical support, both for the highly difficult industry workers to provide a completely custom tools and hundreds of thousands of charts, but also to make products more convenient and efficient.
The industry has pointed out that Arction's LightningChart is specifically designed for professional high-speed software that requires ultra-high-speed data acquisition and real-time data presentation. Its graphics use innovative CPU-saving technology and efficient use of memory resources to provide unparalleled performance for applications: including flicker-free or latency in real-time monitoring, high-resolution data sets, strong interactivity, efficient use of technical resources, etc. Etc. Moreover, the LightningChart version of the upgrade soon, the new version to maintain the old features on the basis of updating a lot of powerful new features, such as:
1. Based on the Directx11 rendering engine, you can more visually more intuitive real-time visualization of high-definition and beautiful data.
2. Accelerated by the value of color, such as: 2D and 3D graphics surface and wire box by color.
3. Support Obj 3D model files
4. HiDPI
5. Disconnect data by NaN or a specified separation value
6. Using the contour line algorithm, the contours are clearer and more accurate (eg, derived contours)
7. Support 2D chart single point coloring
Here's how to draw a simple 2D chart without MVVM mode.
Typically, the user adds the chart to the design environment and configures it with the window properties. In addition, this tutorial does not require a design environment to map directly with code to further provide the best way to maintain maintainability for project development.
Use lightningchart to create a chart case as follows:
1. Create a chart instance.
Work diagram = new lightningchartultimate ();
Sets the parent container of the chart to draw.
Windows forms:
2. Set the parent container for the chart.
Father = this;
The graph is filled with dockstyle. Quay;
WPF:
Set the parent container for the chart.
(mesh for content). Add children (map);
3, create linear series, such as pointlineseries.
The new line series instance is assigned to the default X and Y axes.
VAR series = new pointlineseries (Chart.viewxy,Figure. Viewxy xaxes [0],Figure. Viewxy yaxes [0].);
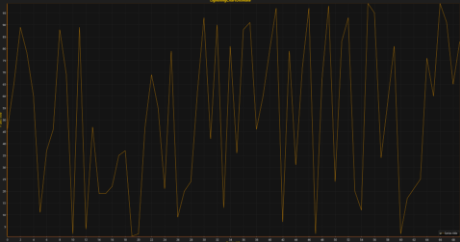
4. Generate random data or convert from source to appropriate format.
Decentralized data random.
Random Rand = new ();
International pointscount = 70;
Use your algorithm to generate some data.
VaR data = new seriespoint [pointscount];
Is (int, I = 0; I < pointscount; i++)
{Data [me]. X = (double) me / / double value";Data [me]. Y = rand. Under the (0100); / / double value";}
5, set the generated data points into series.
Data = / / allocate data.
6, add the created linear series to a set of graphs of a particular series type.
Add the series to the list of point-to-point lines.
Figure. Viewxy. Pointlineseries add (series);
7 、 automatic quantitative graphics axis to display all the serial data points.
Adjust the angle automatically according to the given data.
Figure. Viewxy. Zoomtofit ();
8. Build and run the application.
Over the years of development, Arction has been adhering to the core values of customer achievement, research and development, passion and pursuit and excellence. While striving to provide the most advanced data visualization solutions and superior technical support for different customers, Arction also give customers the best development experience.

© Copyright 2000-2026 COGITO SOFTWARE CO.,LTD. All rights reserved
