Nagios XI--Integrating NagVis With Nagios XI
Parent child relationships are important for highlighting network blockages which prevent excessive notifications. In addition to this they help to easily visualize your network. This document describes how to use the NagVis network status visualization tool with Nagios XI. NagVis is a visualization add-on for Nagios, which allows you to display host and service objects in a visual manner.
 |
Accessing NagVis
To access NagVis navigate to Home > Maps > NagVis. The default home screen provides you with some demo maps that give examples of how NagVis can be utilized.
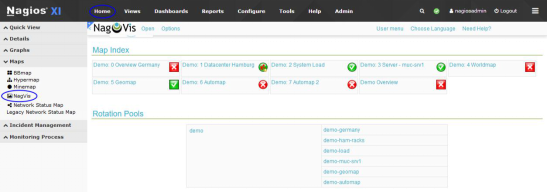
You will also notice the NagVis menus along the top of the screen, how to use these will be explained next.
Using Automap With Parent/Child Relationships
An Automap is an automatically generated display of defined hosts. We'll show you how to create an Automap which also helps learn how the interface works.
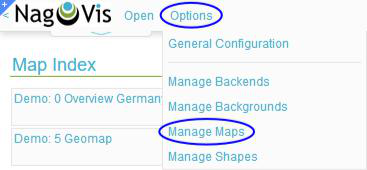
Click the drop down menu Options and select Manage Maps.
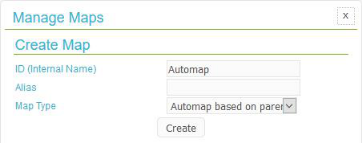
Under the Create Map section provide a name in the ID field.
From the Map Type list select Automap based on parent/child relations.
Click the Create button to create the Map and the screen will refresh displaying the map.
 |
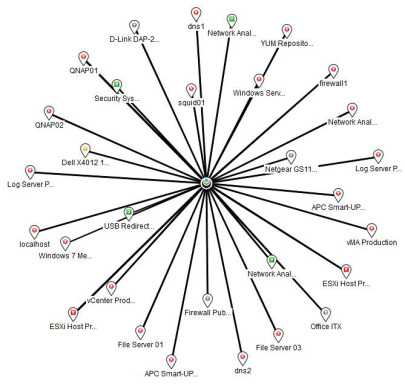
If you haven't defined any parent/child relationships in Nagios XI the Automap shows a simple star map like the following screenshot.
In order for the Automap to be useful you'll need to define parent/child relationships for your Nagios hosts.
Keep reading for instructions on how to configure parent/child relationships and customize the look of the Automap.
Defining Parent/Child Relationships
To define parent/child relationships between hosts, you will need to use Nagios XI Core Config Manager (CCM). Login to Nagios XI and navigate to Configure > Core Config Manager > Monitoring > Hosts.
Edit a host from the list by clicking it (like APC Smart-UPS 1500). You can specify its parent hosts by using the Manage Parents button on the Common Settings tab.
Select the parent host from the list on the left and click
Add Selected > to move it to
the right hand Assigned list.
When finished, click Close and then Save.
Hosts that are one network "hop" away from your Nagios XI monitoring server should have localhost as their parent host.
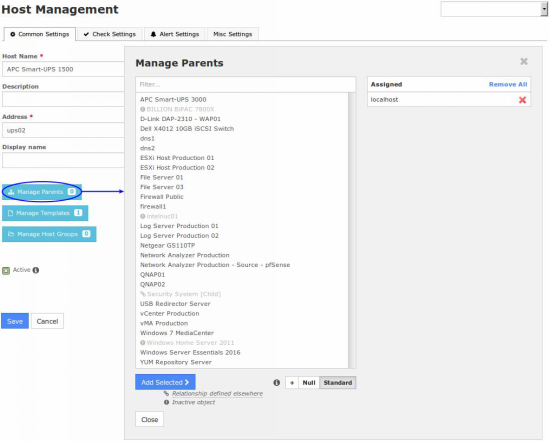
After you have configured some hosts to have localhost as their parent perform an Apply Configuration in CCM.
After defining the parent/child relationships they will show up on the NagVis Automap as per this simple example:
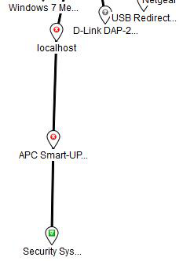
You can define multiple levels of parents, which will result in a more complex map.
In this example you can see that the APC Smart-UPS 3000 appears to be the center of the map. ESXi Host Production 01 and ESXi Host Production 02 are children with further children hanging off them.

Building A Useful Nagios Visualization
Up to now you've seen the automap functionality, but it doesn't scratch the surface of what NagVis can really do. One of the great features of NagVis is the ability to take a picture and place Nagios XI host and service objects on the picture to create something that visually represents what is going on.
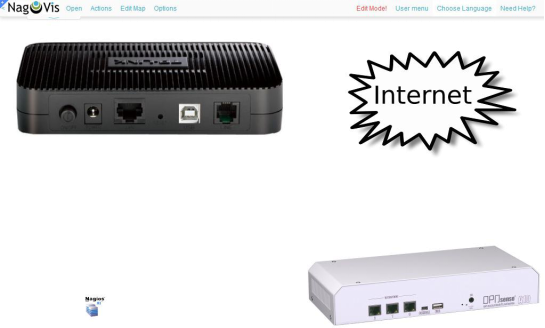
In my environment I connect to the internet via a firewall and that firewall is connected to a DSL modem. This example is going to use images of those devices and overlay the Nagios Services that monitor these devices. In NagVis, an image/picture is called a Shape.
Create A New Map
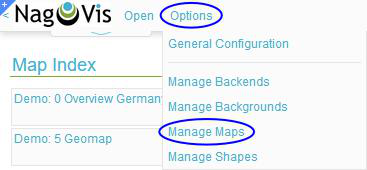 |
Click the menu Options and select Manage Maps.
Under the Create Map section give it an ID, in this example it is Internet_Firewall.
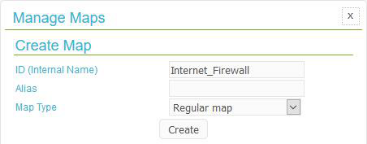 |
From the Map Type list select Regular map and click the Create button.
Once created you will be presented with a blank map.
You will also notice a new drop down menu has appeared called Edit Map. This is how the map will be configured.
Upload Shapes
I have four images I am going to upload to NagVis to represent the devices I am visualizing on my map.
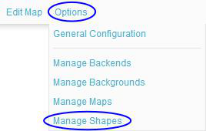
Click the menu Options and select Manage Shapes.
 |
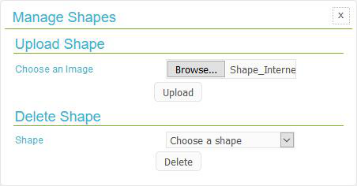
Use the Browse button to select the images you want to upload.
Click Upload to upload the image as a Shape into NagVis.
Repeat the steps to upload all the desired images.
Close the window once you've finished uploading the images.
Add Shapes
The next step is to place the shapes on the map.
Click the drop down menu Edit Map and select Add Special > Shape.
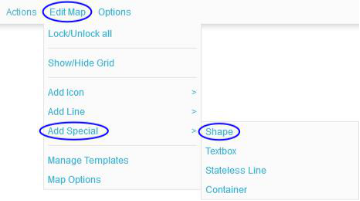 |
It might appear as nothing just happened but you need to click on the map where the shape needs to be placed.
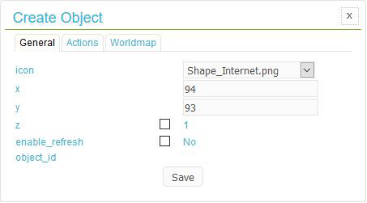
Once you click on the map, the Create Object window will appear.
Select one of the shapes from the icon drop down list.
Click Save to add the shape to the map. The shape will now appear on the map. To re-position it you need to right click the shape and select Unlock.
Repeat these steps until all the shapes required shapes have been added to the map.
 |
The screenshot below shows the four shapes I added.
 |
Host And Service Objects
The next step will be to start adding host and service objects to the map. Nagios XI is monitoring the firewall device and these are the objects that will be placed on the map.

The host and service objects are going to be used in the following way:
? I'm using the Port 2 Bandwidth service as it correctly reflects the traffic direction on the service line
The PING - DSL Gateway service will be used to indicate if the internet connection is active
Add Port Status Icons
The Port Status services will be added to the map on top of the firewall shape.
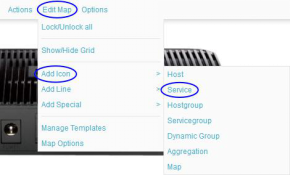
Click the drop down menu Edit Map and select Add Icon > Service.
It might appear as nothing just happened but you need to click on the map where the icon needs to be placed.
I am clicking above the physical WAN port on the firewall shape.
 |
I am clicking above the physical WAN port on the firewall shape.
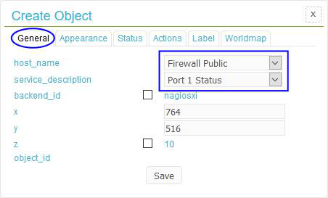
l appear on the General tab.
Select the host from the host_name drop down list.
Select the service from the service_description drop down list.
 |
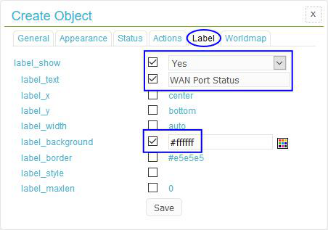
Click the Label tab.
From the label_show drop down list select Yes.
In the label_text field type WAN Port Status.
In the label_background field type #ffffff.
Click Save to add the icon to the map.
 |
Once the icon has been added to the map, you can move it around with the mouse to correctly position it.
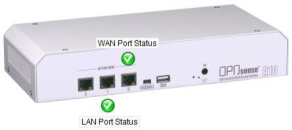
You can also separately move the label to a desired spot on the map. I'm repeating the above step to add the LAN Port Status service as well.
The screenshot to the right shows what it looks like so far:
 |
Add Host Line
Next a host line will be added from the Nagios XI shape to the LAN port on the firewall.
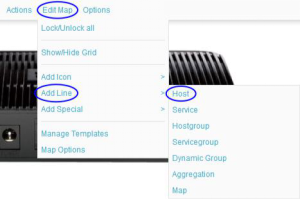
Click the drop down menu Edit Map and select Add Line > Host.
 |
Now you need to click on the map where the line start, in this case I am clicking on the Nagios XI shape. Then you move the mouse to where the line ends (you'll see a line as you move the mouse). I am clicking on the LAN port on the firewall.
Once you do this the Create Object window will appear on the General tab.
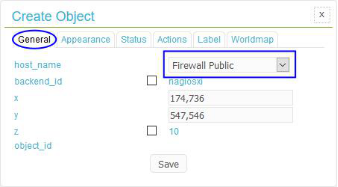 |
Select the host from the host_name drop down list.
Click the Appearance tab.
Select the line_type from the drop down list. ---------->
 |
is being used.
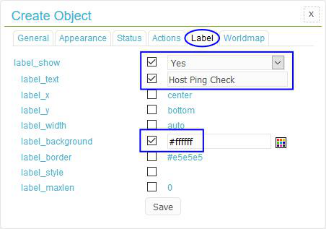
Click the Label tab. From the label_show drop down list select Yes.
In the label_text field type Host Ping Check.
In the label_background field type #ffffff.
Click Save to add the line to the map.
 |
You can see the line has been added and is the color of the status of the host (green/up).
 |
You can also separately move the label to a desired spot on the map, I've placed it on the line. If the host was to go down then the line would be red in color.
Add Service Lines
Next a service line will be added from the WAN port on the firewall shape to the LAN port on the DSL modem.
The service will be the Port 2 Bandwidth service so it will represent the internet traffic.
Click the drop down menu Edit Map and select Add Line > Service.
Now you need to click on the map where the line start, in this case I am clicking on the WAN port on the firewall shape. Then you move the mouse to where the line ends (you'll see a line as you move the mouse), I am clicking on the LAN port on the DSL modem.
Once you do this the Create Object window will appear on the General tab.
Select the host from the host_name drop down list.
Select the service from the service_description drop down list.
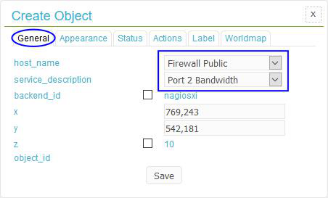 |
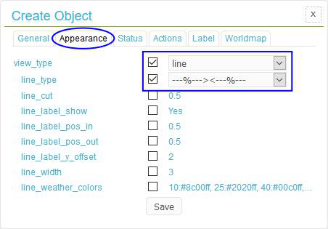
Click the Appearance tab.
Select the line_type from the drop down list.
--%--><--%-- is being used as this will display the numbers from the service on the lines to show the current in/out rate.
Click the Label tab.
From the label_show drop down list select Yes.
In the label_text field type [service_description].
In the label_background field type #ffffff.
Click Save to add the line to the map.
You can see the line has been added and is the color of the status of the host (green/up).
 |
You can also separately move the label to a desired spot on the map, I've moved it just up from the arrows.
Here's a screenshot showing the service line that was added.
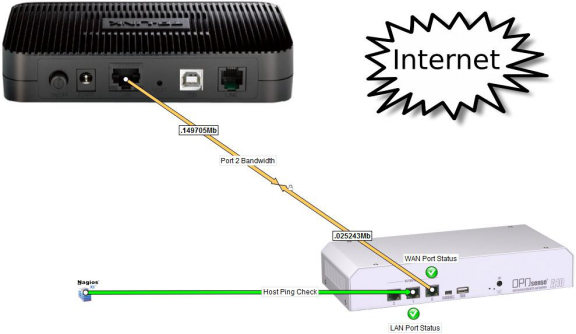 |
You can see the line has two arrows that meet in the middle and on each part of the line there are the bandwidth numbers from the current service output. You can see the number on the upper part of the line is the download from the internet and the number on the lower part of the line is the upload to the internet.
The last service line to add is the PING - DSL Gateway service will be used to indicate that the internet connection is active.
Click the drop down menu Edit Map and select Add Line > Service.
Now you need to click on the map where the line start, in this case I am clicking on the phone line port on the DSL modem shape. Then you move the mouse to where the line ends (you'll see a line as you move the mouse), I am clicking on the Internet shape.
Once you do this the Create Object window will appear on the General tab.
Select the host from the host_name drop down list.
Select the service from the service_description drop down list.
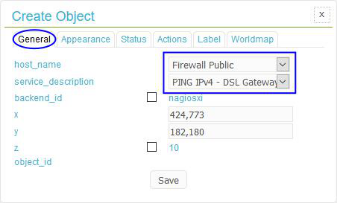 |
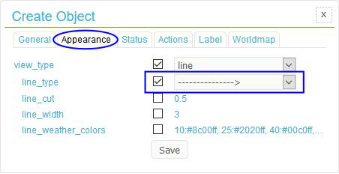
Click the Appearance tab.
Select the line_type from the drop down list. ---------->
is being used.
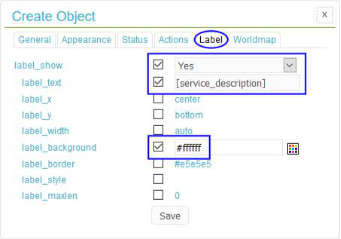
Click the Label tab.
From the label_show drop down list select Yes.
In the label_text field type [service_description].
In the label_background field type #ffffff.
Click Save to add the line to the map.
Here's a screenshot showing the service line that was added.
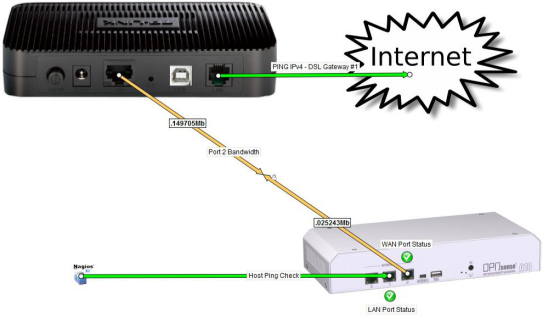
Now I have a visual representation of the physical equipment in relation to the services being monitored in Nagios XI.
Now to generate an issue so we can see what the map looks like when there is a problem. I'm disconnecting the cable that connects the WAN port on the firewall to the LAN port on the DSL modem.
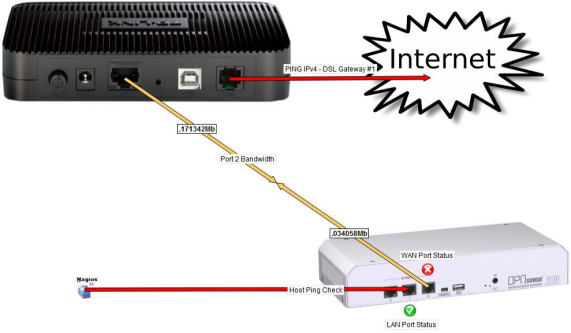
The WAN Port Status icon is an X, indicating that the Port Status service is in a critical state.
The Ping IPv4 - DSL Gateway service line is RED which indicates the service is in a critical state.
The Host Ping Check line is RED, however the LAN Port Status service is green. The reason why the Host Ping Check line is RED is because the HOST object was used and the host has services in a non-OK state, which forces it to go into a RED state. To overcome this you could modify the Host Ping Check line and configure the Status (tab) option recognize_services to No.
You can also hover your mouse over the lines and icons and you will see a summary of the objects. Clicking on the lines or icons will take you to the Nagios XI Status Detail page for that object.
Add NagVis Map As A View
You can add your NagVis maps to the Nagios XI View rotation list, this allows you to see the maps periodically on a monitoring wall.
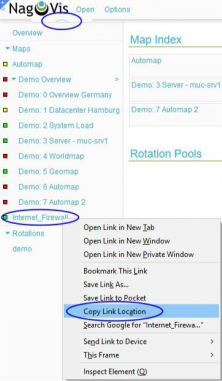
The first step is to obtain the URL for the map. In the top left corner of NagVis click the ? tab to display the left horizontal menu.
Right click on the NagVis map you want and select Copy Link Location.
In this example the URL it copied is:
http://nagios_xi_address/nagvis/frontend/nagvis-js/index.php?mod=Map&act=view&show=Internet_Firewall
The most important part of that URL is &show=Internet_Firewall which is the Map being shown.
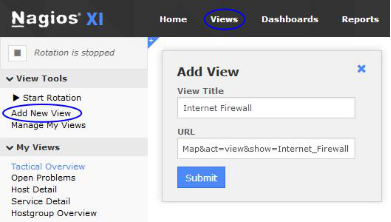
Now click the Views menu on the top navigation bar and then select View Tools > Add New View.
Provide a title for the view and paste the URL from the clipboard into the URL field.
Click the Submit button to create the View.
This will now be displayed in the Views rotations list.
© Copyright 2000-2025 COGITO SOFTWARE CO.,LTD. All rights reserved