Improve your business intelligence by visualizing your complex data with our high-speed JavaScript/HTML5 Pivot component.
It helps you to summarize large data sets in a convenient way.
Key Features
How to Start with dhtmlxPivot
Build your first JavaScript Pivot table with 5 simple steps:
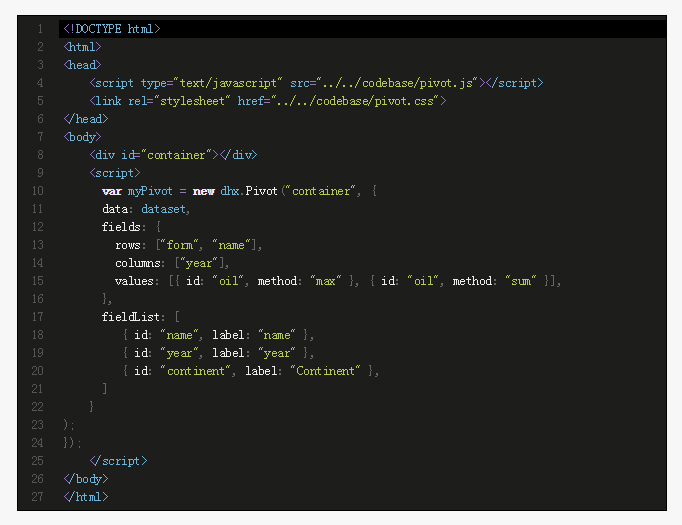
1 Create an HTML file
2 Include the Pivot js and css source files in the header
3 Add a container with an id - e.g. “container”
4 Initialize the widget with the dhx.Pivot object constructor
5 Specify Pivot structure, fields, and other configuration properties you need
Why dhtmlxPivot?
Our JavaScript pivot grid component provides fast performance with large data sets. It's an important benefit for business applications where you need to work with hundreds and thousands of records. DHX Pivot renders considerable amount of data equally well in all web browsers.
The Pivot appearance is fully configurable. All the elements of JavaScript/HTML5 Pivot table layout can be adjusted according to your needs. There is a set of attributes that you can use to modify the look and feel of your table in the blink of an eye.
Since Pivot tables are intended to work with large amount of data, the possibility to load data into your table easily is a must. Our JavaScript pivot grid component supports data loading in the JSON format, which is the simplest and most convenient way.
The end users may want to have labels and elements of a web pivot table in a different language. You can make use of the related Pivot API to fully localize its interface. Thus the component will be displayed in the necessary language. And even may show currency symbols specific to the localization you choose.
Due to simple initialization, which takes just a few steps, DHX Pivot grid has an extremely short learning curvethat significantly increases the development speed.
Besides 4 preset types of data operations (sum, max, min, and count), you can add your own operations, which show how flexible our javascript pivot table is. Pivot table contains the footer, where the resulting values of operations are displayed.
The sorting feature is available in dhtmlxPivot. A single click on header of the row, and ascending/descending sorting icons will appear.
You can apply the filters to display the selective data, narrow or extend your data query. This can be achieved by either pre-defined filters (before data aggregation) or on-the-fly by using UI elements.
In your web pivot table you can style the cells based on specific conditions. As an example, you can highlight min and max values of the cells by different colors. Besides, you can add any custom content to the cell that you need like checkboxes and other elements.
You can export the pivot grid in an excel file using our online export service or get your own export module. The exported documents will include styles and templates you have added to dhtmlxPivot.
|
|
Commercial |
Enterprise |
Ultimate |
|
License Terms |
Read License Agreement |
Read License Agreement |
Read License Agreement |
|
Developers |
5 |
20 |
∞ |
|
Projects |
1 |
5 |
∞ |
|
SaaS |
- |
? |
? |
|
Perpetual distribution rights |
? |
? |
? |
|
Support Plan |
Standard Support |
Premium Support |
Ultimate Support |
|
Time Period |
1 year |
1 year |
1 year |
|
Updates |
Minor & major updates Bug fixes
|
Minor & major updates Bug fixes
|
Minor & major updates Bug fixes Emergency bug fixes
|
|
Tickets |
10 |
30 |
∞ |
|
Response Time |
72h |
48h |
24h |
|
Personal Account Manager |
- |
- |
? |
|
Functionality |
Professional |
Professional |
Professional |
|
Online export to Excel |
Free |
Free |
Free |
|
Free local export module to Excel |
- |
- |
? |

© Copyright 2000-2025 COGITO SOFTWARE CO.,LTD. All rights reserved
