What’s New in Surfer 19
There are a ton of awesome new features in the latest release of Surfer! We focused on increasing processing speed, optimizing workflows to maximize your efficiency, and we included a lot of exciting new features as well. The top new features are listed below.
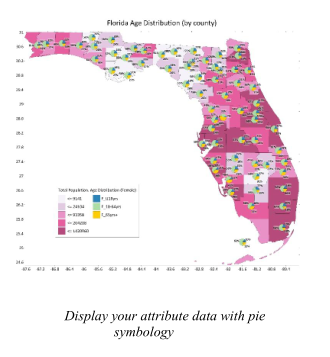
1. Create Pie Maps
You can now display your numeric attributed data using Pie maps! Use the Base Symbology tool to choose which attributes from your vector file you're interested in, then represent the proportions of these components with colored pie slices. Size the pies proportionally or use a fixed size, customize colors, labels, position and formatting. This is a great way to display demographics data from the US Census, sample concentrations from your recent field season, or even geographically-varying survey responses.
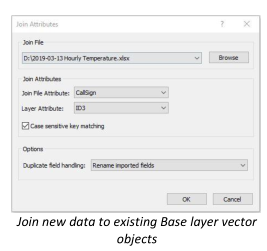
2. Join attributes to your vector objects in the Attribute Table
Link attribute data to vector objects in a Base layer using attribute names, also known as a Spatial Join. Once your vector objects have new attributes associated with them, you can create thematic maps from these objects using Base Symbology (you can even use the new Pie Map symbology feature!). For example, if you have borehole sample locations that are continually generating new field data, you can link this new data to your Base map borehole locations using the UWI or another Object ID. Then, easily map your changing chemical composition data over time.
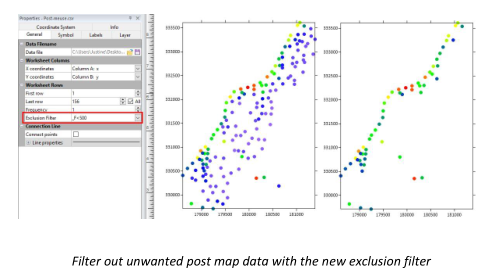
3. Post map data exclusion filter
Display only the Post map points that you're interested in without having to edit the source data file. Remove points from your Post or Classed Post layer based on numeric criteria. Exclude points based on X value criteria, Y value criteria, or by numeric criteria in another column in the data file. You can use logic statements in the same way you would in the Data Exclusion Filter through Grid Data or the Worksheet.
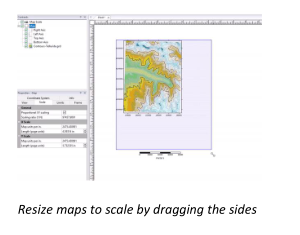
4. Scale maps accurately by dragging the outer bounding box
Throughout Surfer's history we've been telling you not to resize maps by dragging the sides because it destroys the internal scaling of your maps. We won't be telling you that anymore! Resize your maps by dragging the sides - Surfer will now retain the scaling, and will update any Scale Bars to match the new dimensions. The new Map scale is calculated and displayed in the Properties window, so you can get it as accurate as you need.
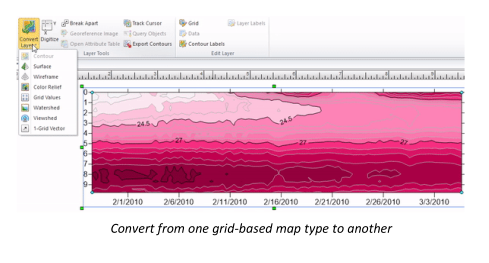
5. Convert between grid-based map types
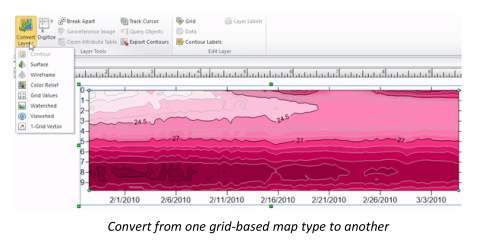
Grid-based maps can now be converted to other grid-based maps by using the Convert Layer tool. If you make a mistake and create the wrong map layer type, you don't need to reload the file again, just convert the layer directly to the type that you need.
6. Create maps more quickly and easily
We've made map creation more intuitive, and faster too! Click File | Open, select your data orgrid file, and a new map is immediately created. Select multiple files during File | Open to create multiple maps instantly. If you need to edit the source data file, you can still open it directly using the Open in Worksheet command. Similarly, source grid files can be opened by clicking Grids | Grid Editor.
7. Drag and drop files to create maps
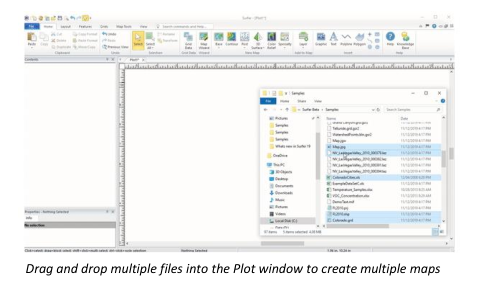
Drag one or more files from Windows File Explorer or your Desktop onto your Plot document and maps are instantly created. Drag grid files onto the Plot window to create Color Relief maps, then use the Convert Layer tools to change them to Contour, 3D Surface, or Watershed maps. Drag vector files onto the Plot to create Base(vector) maps, and drag XYZ data onto the Plot to create Post maps.
8. Faster contouring
Contour map generation is now multi-threaded, optimized, and is 7 times faster! If you use large grid files or display your data with a close contour interval, these efficiency improvements will save you a ton of time. The updated progress gauge now lets you know exactly how much time to wait.
9. Grids/Data/Image files are shared between maps
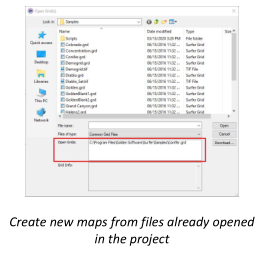
This makes your SRF project both smaller and faster. If you use the same input file for multiple map types (a color relief and contour map, for example), these files are now shared rather than being duplicated in your SRF project file. The same applies for vector files and image files. When creating a new map layer in Surfer, you can choose whether to use a new file, or one that's already saved into your project.
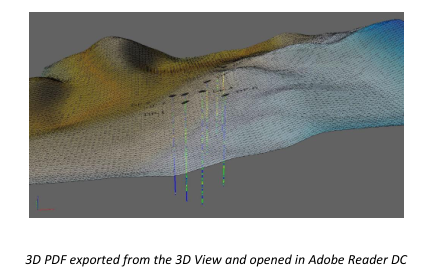
10. Export 3D PDF
Export your models from the 3D View into the interactive 3D PDF format. Add surfaces, axes, points, and contours, rotate around your model, change lighting and model display style, and more! This new functionality is great for communicating your work to stakeholders. The exported 3D PDFs can be viewed in Adobe Reader DC and other PDF applications that support 3D data display.
11. 3D View Undo
The Undo command has been added to the 3D Viewer, so you can undo model rotation, lighting changes, vertical exaggeration changes, and object formatting changes
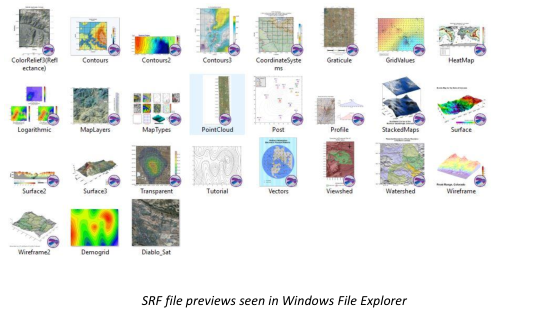
12. See SRF Previews in Windows File Explorer
You no longer have to open all of your SRF projects to figure out which one you're looking for. The Plot window contents for SRF files created in Surfer 16 or newer can now be previewed as thumbnails in Windows File Explorer.
13. Zoom Previous / Previous View
Undo your previous mouse-wheel zoom with the Zoom Previous command. If you make a mistake with your zoom level, use this button to snap right back to the previous view position. Assign your preferred keyboard shortcut so it's right at your fingertips whenever you need it.
14. Copy/Paste Format Classed Post Map intervals
The Copy Format/Paste Format tool now also handles classed post intervals. Easily transfer your intervals from one map to another without having to type them out manually.
© Copyright 2000-2025 COGITO SOFTWARE CO.,LTD. All rights reserved