Ultimate UI for Android
Lightning-fast native controls for great-looking responsive apps
Dynamic, zoomable chart controls are perfect for analyzing large sets of data, while the high-performance data grid is ideal for your next mobile line-of-business application.
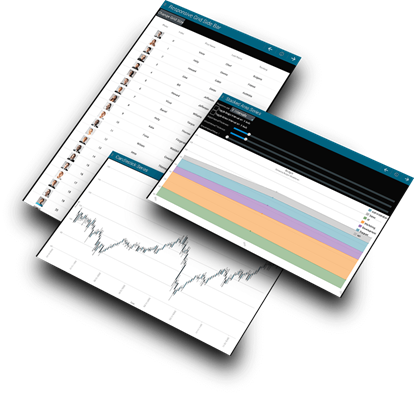
Ultimate Native UI Controls for Android
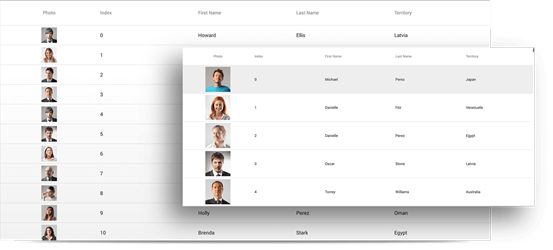
Android Data Grid
The Android Data Grid is a brand new cross-platform grid built specifically to meet the challenges of displaying large amounts of data on mobile platforms. Built for the mobile world, the Android Data Grid is lightweight, feature-rich, responsive, and can handle large amounts of data while providing superior versatility and performance.
Data Source
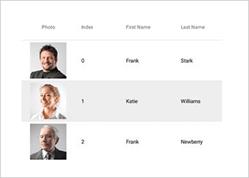
The grid's data can be local (available on the device already), or the grid can retrieve data from a remote store such as a web service.

Sorting and Filtering
Sort to columns in either ascending or descending order. Sorting can be applied to multiple columns to perform more advanced sorting operations. A powerful filtering engine allows complete control to filter your data. Use a wide range of filters such as function expressions, literal expressions, arithmetic operands, and logical operands to build advance filtering capabilities that can span multiple columns.

Built-in Columns
Easily create a grid with auto-generated columns or select the column types among our built-in columns, including text, numeric, image, date/time, and template. All columns’ cells and headers can be configured by setting text properties like text color, font size, background color, alignment, and width.

Responsive Layout
Our grid dynamically changes the visible columns based on available width by setting break points at different widths or based on the orientation of the device.

Animation
Control columns' Showing, Hiding, Adding, Moving, and Exchanging in a variety of animations, including left, right, top, bottom, fade in, crossfade, or slide over.

Live Scrolling
Data is retrieved over the web as you are scrolling down, thus ensuring high performance at all times by minimizing the amount of data that needed to transmit to the device.

Selection
Single and multi-row selection is supported for scenarios such as highlighting a row or a master/detail view.

Data Chart
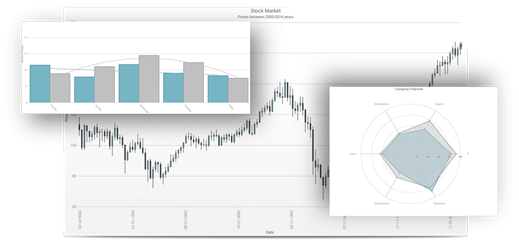
Does your Android app need to process thousands of rows of complex data with speed and agility? Our Data Chart control is here to help with the tools you need to create engaging experiences for your customers.
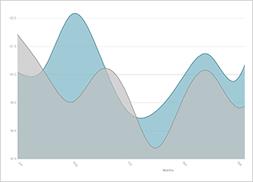
Small Screens, Superior Charting
Easily build complete mobile analytical solutions with Candlestick and OHLC bar charts as well as many built-in technical indicators such as: Wilder's RSI, MACD, a Money Flow Index, Bollinger Bands, Moving Averages, and more.

Modular Design
Build charts that incorporate multiple chart areas, multiple chart layers, and multiple axes.

High Performance Rendering
The Android Data Chart is built to take on your most complex data. Real-time feeds are easily processed when you design your chart to update itself frequently.

Hosted Content
Enhance your legends and captions with rich, hosted content, or place your own controls into the data chart's visual tree.
Panning and Zooming
With touch gestures like drag, pinch, and double tap, your users can easily explore their data.
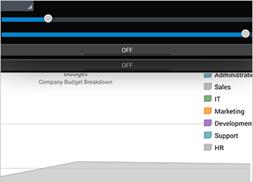
Annotation Layers
These interactive features of the data chart appear when a user performs a tap and/or drag gesture. Layers are overlaid on top of chart series to display or highlight information about data in the form of crosshairs, tooltips, or highlighted columns and markers.

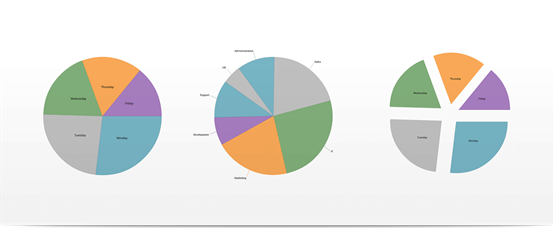
Pie Chart
Create simple or exploded pie charts with a customizable threshold for inclusion in an Others category. Text labels and images can be displayed within or outside of the pie in a manner that avoids overlapping. Users can then drill down to view underlying data, explode out a section of the pie, and find information via tooltips.
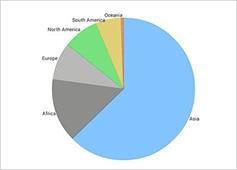
Others Category
The Others category in the Pie Chart control can be used to group the smaller data values into one slice. Use the drop-down in the Threshold Category to select a threshold value and see how the smaller slices are grouped into one slice labeled Others.
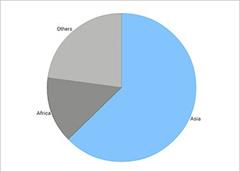
Customizing the Pie Chart
Use the Pie Chart control to set the radius factor, the exploded radius, and the start angle.

Pie Chart Labels
Customize the label extent and label position.

Radial Gauge
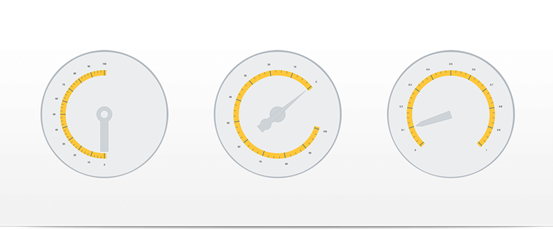
Make data visualizations and dashboards more engaging with a Radial Gauge that shows off KPIs with rich style and interactivity. The round and semi-round gauges are powerful, easy to use, and highly configurable to present dashboards that display clocks, industrial panels, automotive dashboards, and even aircraft cockpits.
Fully Configurable Radial Scale
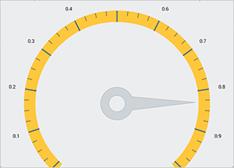
Control the start and end positions of the scale, major and minor tick marks, labels, color ranges, and sweep direction. You can create full 360-degree scales, or half-circular gauges with 180-degree, 90-degree, 45-degree scales, or any custom value you choose.

Configurable Needles
Customize the gauge's needle attributes, such as color, length, point, base, and cape. Pre-set configurations include rectangle, triangle, needle (with or without bulb), and more.

Configurable Backing
Control various visual attributes such as colors, shape, around-the-gauge edges (fitted or circular), oversweep, and corner radius.
Motion Framework Animation Support
The Radial Gauge control supports animated transitions between configuration states. The control gradually animates as it redraws changes to the needle, needle position, scale range, color range, and more. You can control the speed of the animations by setting the desired transition duration.

© Copyright 2000-2025 COGITO SOFTWARE CO.,LTD. All rights reserved