lightningChart
22. Using Windows Forms chart in WPF application
Note: LightningChart has 3 WPF API’s available. Consider using WinForms chart API in WPF application
only in special cases.
22.1 How about using Arction Windows Forms controls in WPF?
In WPF, you can use Windows Forms components by adding Arction.WinForms.Charting.LightningChartUltimate.dll and Arction.WinForms.SignalProcessing.SignalTools.dll as reference to your project, and creating them by code. LightningChartUltimate control and most of other controls have a built-in UI. Use WindowsFormsHost as parent container to these. These controls can be used also without UI, with their methods and properties.
22.2 Should I use Arction.WinForms.LightningChartUltimate in WPF?
Using WPF chart assemblies is recommended over WinForms chart in WPF applications, because it doesn’t need the WindowsFormsHost control, and thus does not have the generic “airspace” problem of WindowsFormsHost control. Another advantage is that the WPF chart can have transparent background and the charts can be placed one over another.
Using WindowsFormsHost control with WinForms chart control can be considered to be used when absolutely maximum performance is required. WindowsFormsHost + WinForms chart rendering is slightly faster.
If you choose to use the WinForms chart in WPF application, it must be placed inside WindowsFormsHost control. Add a WindowsFormsHost control (found in the Visual Studio WPF Toolbox) into your WPF form.

Figure 22-1. WPF example application in designer. WindowsFormsHost control keeps the LightningChartUlitmate object inside when the application is executed.
Create a LightningChartUltimate object and place it inside the WinFormsHost object in code. Open the form xaml.cs file and create the chart in the form constructor:
public WindowMain()
{
InitializeComponent();
CreateChart();
}
private LightningChartUltimate m_chart = null;
void CreateChart()
{
m_chart = new LightningChartUltimate();
//Set the chart object as child to the WindowsFormsHost control
windowsFormsHost1.Child = m_chart;
}
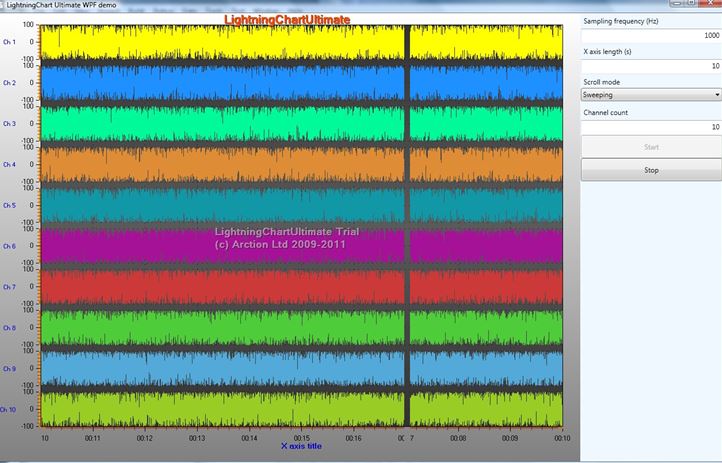
Figure 22-2 WinForms chart in WPF application.
23. Using LightningChart in C++ applications
LightningChart is a .NET library and it can be used with C# and VB.NET languages most fluently. But it can be used in C++ Win32 applications, including MFC applications, too. The application using LightningChart must be compiled with Common Language Runtime Support (/clr) option. Open it from Project -> Properties menu, and open Configuration Properties, General page.
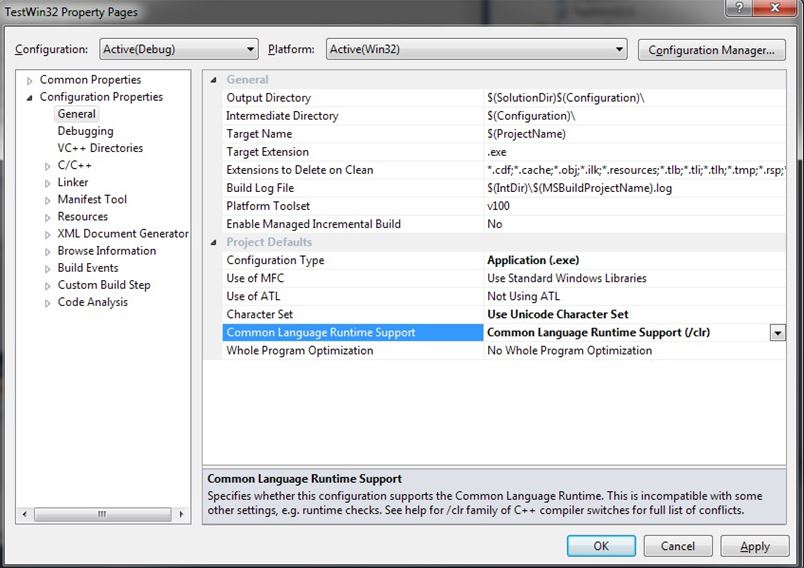
Figure 23-1. C++ application property pages in Visual Studio 2010. Setting of Common Language Runtime support.
The .NET library is now accessible with C++/CLI syntax, C++ with .NET extensions.
Add the .NET assembly references in property pages, Common properties, Framework and References. Add the following .NET assemblies:
- Arction.WinForms.Charting.LightningChartUltimate(found in install folder or install folder -> LibNET4)
- System(framework assembly)
- System.Windows.Forms (framework assembly)

Figure 23-2. Adding .NET references.
In Configuration Properties, C/C++ page, modify Resolve #using references path to location where the
Arction assemblies can be found at development time.
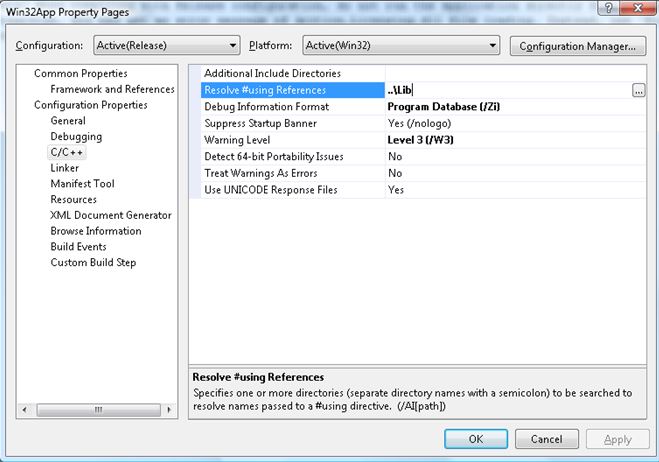
Figure 23-3. Setting “Resolve #using References” path.
Include the library and relevant namespaces after your include rows as follows:
#include "stdafx.h"
#include
…
//Include Arction DLLs and relevant namespaces
#using "Arction.WinForms.Charting.LightningChartUltimate.dll" using namespace Arction::WinForms::Charting;
using namespace Arction::WinForms::Charting::Axes;
using namespace Arction::WinForms::Charting::SeriesXY;
Declare a class to store global .NET managed variables:
//"Global managed variables"
ref class GlobalObjects
{
public:
static Arction::WinForms::Charting::LightningChartUltimate^ chart;
};
Create an object of this class and LightningChartUltimate object inside it, for example in InitInstance
function:
BOOL InitInstance(HINSTANCE hInstance, int nCmdShow)
{
HWND hWnd;
hInst = hInstance; // Store instance handle in our global variable hWnd = CreateWindow(szWindowClass, szTitle, WS_OVERLAPPEDWINDOW,
CW_USEDEFAULT, 0, CW_USEDEFAULT, 0, NULL, NULL, hInstance, NULL);
if (!hWnd)
{
return FALSE;
}
CreateChart(hWnd); //Chart create function
ShowWindow(hWnd, nCmdShow); UpdateWindow(hWnd);
return TRUE;
}
Chart creation method can be like the following:
//Create a LightningChartUltimate object and place it inside the parent window void CreateChart(HWND hwndParent)
{
GlobalObjects^ go = gcnew GlobalObjects();
go->chart = gcnew LightningChartUltimate("/* Create key in License manager program");
LightningChartUltimate^ chart = go->chart;
//Disable repaints for every property change chart->BeginUpdate();
//Set parent window by window handle
chart->SetParentWindow((System::IntPtr) hwndParent);
//Remove existing series
chart->ViewXY->PointLineSeries->Clear();
//Create new series
PointLineSeries^ series = gcnew PointLineSeries(chart->ViewXY, chart->ViewXY->XAxes[0],
chart->ViewXY->YAxes[0]);
const int PointCount = 10;
//Create SeriesPoint array array ^ data =
gcnew array(PointCount);
//Fill the array
double yValues[PointCount] = {0.0, 5.0, 4.0, 3.0, 8.0, 10.0, 9.0, 8.0, 3.0, 2.0};
for(int i=0; i
{
data[i].X = i+1;
data[i].Y = yValues[i];
}
//Add the points to series series->AddPoints(data,false);
//Add the series itself into chart's PointLineSeries collection chart->ViewXY->PointLineSeries->Add(series);
//Fit the axis ranges to data assigned chart->ViewXY->ZoomToFit();
//Allow repaints, update chart chart->EndUpdate();
}
Add handling for WM_SIZE message (window is resized):
LRESULT CALLBACK WndProc(HWND hWnd, UINT message, WPARAM wParam, LPARAM lParam)
{
int wmId, wmEvent; PAINTSTRUCT ps;
HDC hdc;
switch (message)
{
case WM_SIZE:
{
GlobalObjects^ go = gcnew GlobalObjects();
if(go->chart != nullptr)
go->chart->SetBounds(0,0,0xFFFF & lParam, 0xFFFF &(lParam >> 16));
break;
}
}
return 0;
}
The resulting application of this example looks like the following, when compiled and executed:
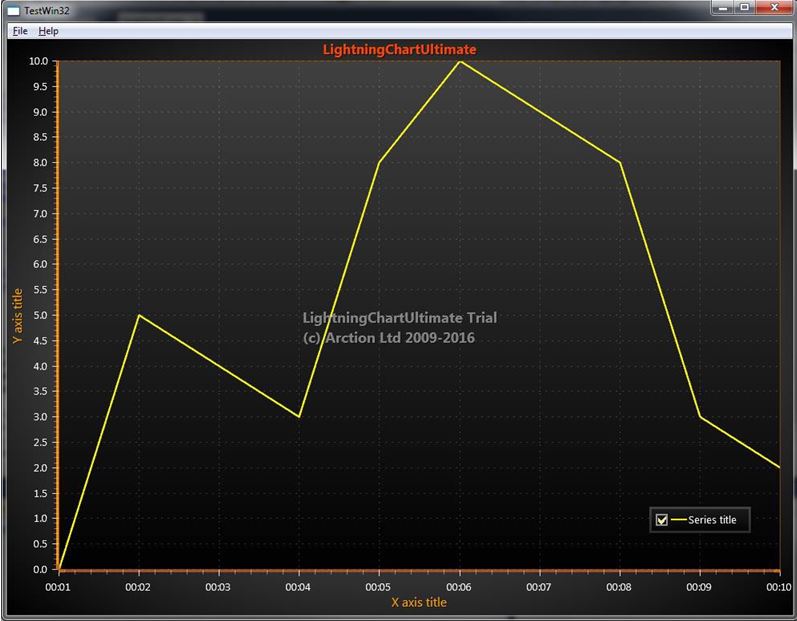
Figure 23-4. Example application executed.
24. Dispose pattern
24.1 Chart created in code
24.1.1 Chart disposing
When you have created the chart in code, and don't need that chart anymore, call
chart.Dispose();
to free the memory of the chart and all its objects, such as series, markers, palette steps...
24.1.2 Objects disposing
If you create objects on the fly, and want to free their memory before exiting the application or disposing the whole chart [with chart.Dispose()] , remove the object from the collection it has been added to, and then call Dispose() for the object.
E.g. Disposing a series from chart.ViewXY.PointLineSeries collection:
//Do cleanup... Remove and dispose 3 series
_chart.BeginUpdate();
List listSeriesToBeRemoved = new List(); listSeriesToBeRemoved.Add(_chart.ViewXY.PointLineSeries[1]); listSeriesToBeRemoved.Add(_chart.ViewXY.PointLineSeries[3]); listSeriesToBeRemoved.Add(_chart.ViewXY.PointLineSeries[4]);
foreach (PointLineSeries pls in listSeriesToBeRemoved)
{
_chart.ViewXY.PointLineSeries.Remove(pls);
pls.Dispose();
}
_chart.EndUpdate();
When LightingChart's objects are not needed anymore it's good practice to Dispose them to prevent memory leaking.

© Copyright 2000-2026 COGITO SOFTWARE CO.,LTD. All rights reserved
