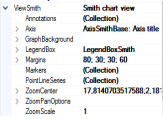
9. ViewSmith
Smith charts are generally used in electronics in impedance measurements and impedance matching applications.
Smith chart plots the data in real in imaginary values (R + jX) .
Terms
Impedance = Z = R + jX
R = Resistance, Real part
X = Reactance, Imaginary part
X > 0: Capacitive
X < 0: Inductive
The data position is determined on 2D-plot by angular on circular Real and Imaginary log-log scales.
Figure 9-1. ViewSmith property tree.
9.1 Axis
The Smith chart has only one real axis, which can be configured via extended property tree Axis, see figure below.
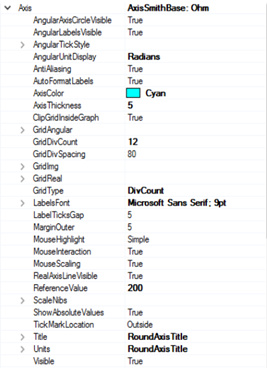
Figure 9-2. AxisSmith property tree.
Most of the properties are identical to the PolarView's axes and ViewXY's axes to customize and make it more attractive, there are added advanced properties especially for SmithView adjustment, e.g. GridDivCount, GridImg and GridReal, RealAxisLineVisible, ShowAbsoluteValues, ClipGridInsideGraph.
GridDivCount defines amount of circular grid lines on Real Axes and logarithmic grid lines on Imaginary scale.
GridImg and GridReal each of these properties is responsible for customizing the grid lines either on Real or Imaginary scales. In addition, there is a property to hide the grid, thus a user may hide one of them and continue to work with another.
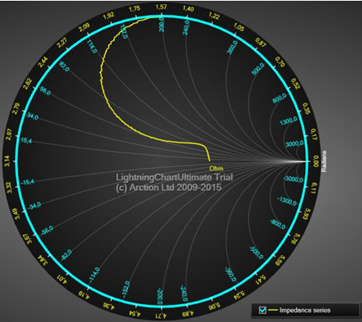
Figure 9-3. Real grid lines are hidden, Imaginary lines are visible.

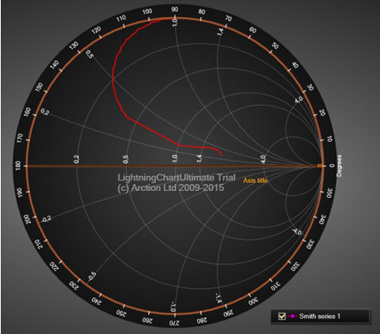
Figure 9-4. Imaginary grid lines are hidden, real lines are visible.
RealAxisLineVisible this property hides the axis line, see Figure 9-3.
ShowAbsoluteValues this property defines which values will be on scales (absolute or normalised).
ClipGridInsideGraph. Gridlines are visible outside the chart circle.
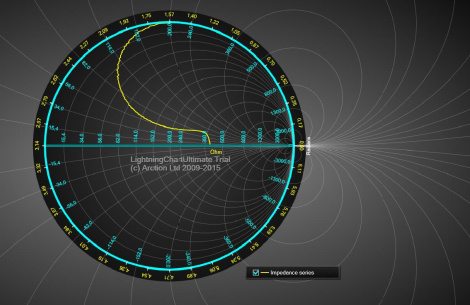
Figure 9-5. ClipGridInsideGraph = False.
The fully customized Smith chart, you can see below.
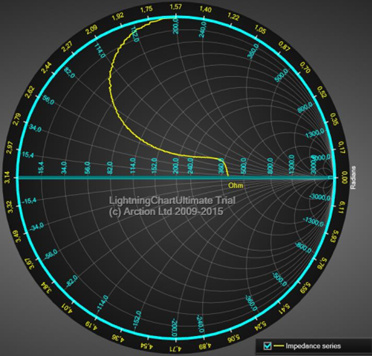
Figure 9-6. Customized Smith chart.
9.2 PointLineSeries
SmithView’s PointLineSeries can be also used to draw a line, group of points or point-line as in PolarView. Lots of line and point styles are available in LineStyle and PointStyle properties.
Figure 9-7. Smith data series.
9.3 Setting data
The code below, will add one set of data points to the collection of the Smith chart.
SmithSeriesPoint[] m_aPoints;
PointLineSeriesSmith Series = new PointLineSeriesSmith(m_chart.ViewSmith, axis);
//Create data for series m_iCount = 5000;
m_aPoints = new SmithSeriesPoint[m_iCount];
for (int i = 0; i < m_iCount; i++)
{
// Sine from left to right
m_aPoints[i].RealValue = i * (MaxReal / m_iCount);
m_aPoints[i].ImgValue = Math.Sin(0.01 * i)/Math.PI * MaxReal;
}
Series.Points = m_aPoints;
//Add series to chart m_chart.ViewSmith.PointLineSeries.Add(Series);
9.4 Annotations
Annotations are identical to ViewPolar’s Annotations, see section 8.5. Target is Location are defined in
Polar axis values. Sizing property has only values Automatic and ScreenCoordinates.
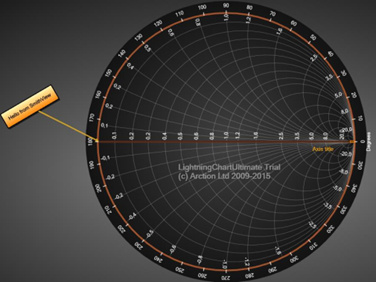
Figure 9-8. An annotation in Smith view.
9.5 Markers
Markers can be used a specific data value at certain position. Markers can be moved by dragging it with mouse. This property has identical definition with ViewPolar's markers, see section 8.6.
Assign the marker with a preferred axis by setting its AssignPolarAxisIndex. Define Amplitude and AngleValue properties to put it into place. Edit Symbol to have the appearance you want, and define text with Label property.
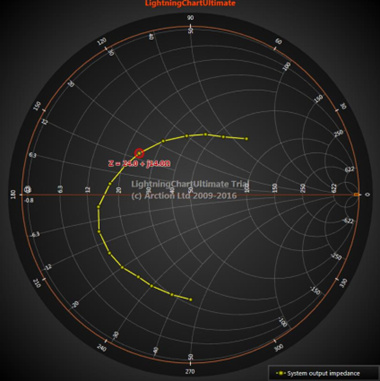
Figure 9-9. A marker tracking a series in Smith view.
10. Setting color theme
Set the color theme with ColorTheme property. Setting the theme will override majority of the object colors in the chart you’ve created. It is advised to first set the ColorTheme and then the object colors you want to be different.
Note! By setting the color theme, you will lose the colors that you’ve manually assigned in the Visual
Studio property grid, without a warning.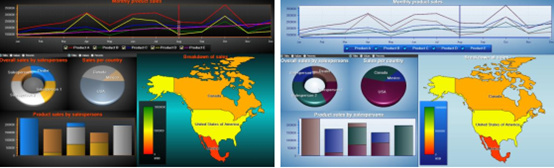
Figure 10-1. Different color themes in use. On the left, default Dark theme with some custom colors. On the right, LightBlue theme set.

© Copyright 2000-2025 COGITO SOFTWARE CO.,LTD. All rights reserved
