OVERVIEW
Nagios Network Analyzer is an application designed to give you a comprehensive view of your network traffic and composition by combining flow (NetFlow, sFlow, J-Flow, IPFIX) analysis with data from other best-in-class open source network security tools. The revolutionary 2026 release features easy onboarding and robust integration with Suricata, Wireshark, and Nmap, all within a modern, intuitive interface.
Flow data analysis provides details on the source and destination IP addresses and ports communicating on network devices, and deeper insight can be achieved by leveraging the built-in integrations with powerful network security tools. Visualize top talkers, run live scans, inspect packets, and alert on security threats—all from customizable dashboards that put critical information at your fingertips. Seamlessly integrate with Nagios XI and Nagios Core for unified infrastructure monitoring.
KEY FEATURES
1. Industry Standard Flow Collection & Analysis
Collect and analyze network flow data from routers, switches, and software probes throughout your infrastructure. Supports NetFlow, sFlow, J-Flow, and IPFIX protocols. Collected data from these flow sources can be visualized in dashboards, exported in reports, and alerted on using a variety of built-in notification methods. View bandwidth utilization, traffic patterns, and top talkers through intuitive graphs, charts, and tables.
Create custom source groups that reflect your existing infrastructure organization.
2. Integrated Security Tools Suite
Easily integrate and manage best-in-class open source network security tools using the included installation commands. Built-in specialized user interfaces for each tool make everything from running and scheduling Nmap scans to importing PCAPs, inspecting packets, and checking for Suricata Signature IDs straightforward and accessible:
Suricata: Real-time intrusion detection and prevention. Run live interface scans, manage 26+ pre-loaded commercial and open-source rulesets, view alerts based on Signature IDs (SIDs), and cross-reference packet data with Nmap and Wireshark scans. Execute Whois, Reverse DNS, and Nmap scans of source and destination IPs found in Suricata events.
Wireshark: Comprehensive packet capture and analysis. Run live captures on-demand, inspect individual packets in summary, detailed, and raw JSON views, trigger targeted captures directly from Suricata alerts, and send PCAP files generated by scans to Suricata for further analysis.
Nmap: Powerful network scanning and discovery. Perform live on-demand scans, schedule recurring scans for continuous visibility, compare previously run scans with Ndiffs to detect newly added or removed devices, use built-in scan profiles for quick access to common settings, create
custom profiles, alert on numbers of open/closed ports, and search Suricata for results found in scans.
3. Comprehensive Dashboards & Visualizations
The Home screen provides instant visibility of traffic on all flow sources, Suricata alerts, scheduled Nmap scans, and Wireshark captures. Create custom dashboards with drag-and-drop panels using graphs, charts, and tables to display the metrics most important to your role. Available in both dark and light themes, dashboards can be downloaded on-demand or scheduled for automatic delivery as PDF or JPG reports. Every graph, table,
and visualization is designed with the user in mind for an intuitive experience.
4. Robust Alerting & Problem Detection
Configure Network Analyzer to look for specific types of network traffic and events, then display results in the interface, send proactive notifications, and execute custom scripts when they are found. Combine query-based alerts on flow data, Nmap open/closed ports, and Suricata Signature IDs with multiple notification methods. Receive alerts when bandwidth usage meeting set criteria exceeds your thresholds, when Nmap scans find defined numbers of open or closed ports, or when Suricata Signature IDs are found. Notifications can be sent by email, forwarded to
Nagios XI with NRDP, sent as an SNMP Trap, or trigger custom script execution. Checks run every five minutes with configurable WARNING and CRITICAL thresholds.
KEY BENEFITS
1. Enhanced Network Security & Threat Detection
Prevent network compromises and maintain network security by identifying potential security threats such as DDoS attacks, unauthorized port traffic, and rogue devices. Alert on network behavior, problematic traffic, and security threats for rapid awareness and quick response. The
integrated Suricata IDS/IPS provides enterprise-grade security monitoring without additional infrastructure complexity. Detailed logs and metadata support faster incident response and forensic investigations.
2. Accelerated Troubleshooting & Root Cause Analysis
Use Network Analyzer’s visualization and data analysis tools to quickly diagnose and resolve network issues. Drill down into the top talkers list to identify the IP addresses and ports using the most bandwidth. Help pinpoint the root cause of sluggish network performance and outages with Wireshark packet inspection and Nmap network composition scanning. Compare Nmap scans over time with Ndiffs to see what has been added or removed on the network. Trigger targeted packet captures directly from Suricata alerts for immediate analysis.
3. Holistic Network Visibility & Monitoring
Seamlessly integrate with Nagios XI to see Network Analyzer alerts right alongside problems found by XI. Create Nagios checks within Network Analyzer to send critical system metrics upstream to Nagios XI, or poll Network Analyzer queries directly with XI using the Network Analyzer Wizard. Add valuable context to problems found by Nagios XI and Nagios Log Server for comprehensive visibility of network issues from multiple key perspectives. Centralized monitoring eliminates tool sprawl and provides complete infrastructure visibility.
4. Improved Operational Efficiency
Fine-tune network configurations to improve performance, increase security, and optimize network routing and bandwidth allocation. Analyze network traffic patterns and monitor network usage of specific applications to ensure business processes are running smoothly. Multi-tenancy capabilities allow IT teams to work together efficiently. Define Roles to determine both the level of Network Analyzer application access as well as granular settings for the various capabilities of each integration, ensuring users can see and do only what matches their role and responsibilities.
Nagios XI Integration Highlights
• Configure integration using API key authentication for secure communication
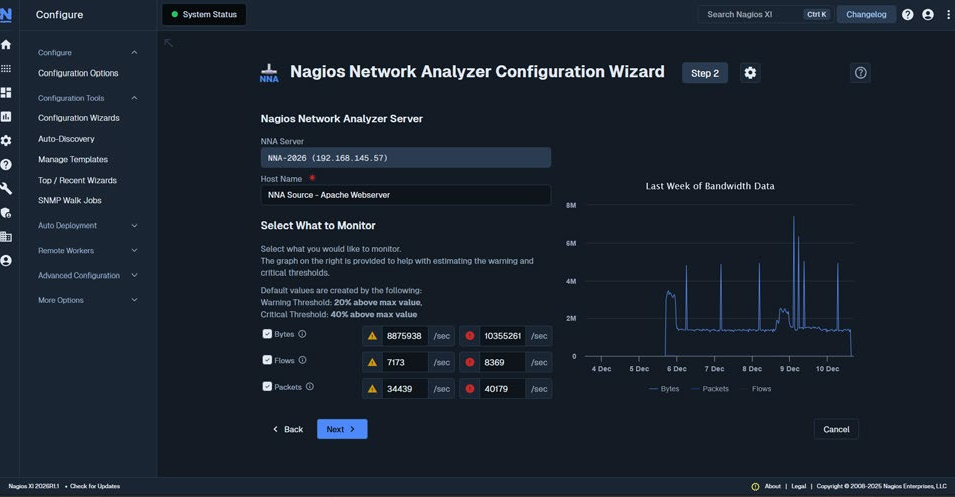
• Set up active checks with the Nagios Network Analyzer Configuration Wizard
• Send passive check results to Nagios XI or Core using NRDP protocol
• View Network Analyzer alert data in Nagios XI reports and dashboards
• Query check results directly via REST API for custom integrations
• Communication over TCP ports 80 or 443 (HTTP/HTTPS)
|
Data Sources:
|
NetFlow, sFlow, J-Flow, IPFIX, PCAPs, Wireshark/Nmap/Suricata scan data |
|
Deployment: |
On-premises software solution |
|
Integration:
|
Nagios XI, Nagios Core (NRDP) , Slack, Outlook , REST API |
|
Security Tools: |
Suricata, Wireshark, Nmap (Integration ready) |
|
User Management:
|
Granular role-based access control, multi-tenancy support |
|
Migration: |
Migration tools available from Network Analyzer 2024 to 2026 |
Ready to transform your network visibility?
Getting started with Nagios Network Analyzer is easy. Download the trial and experience the power of integrated flow analysis, intrusion detection, packet capture, and network scanning—all in one platform.

© Copyright 2000-2025 COGITO SOFTWARE CO.,LTD. All rights reserved
