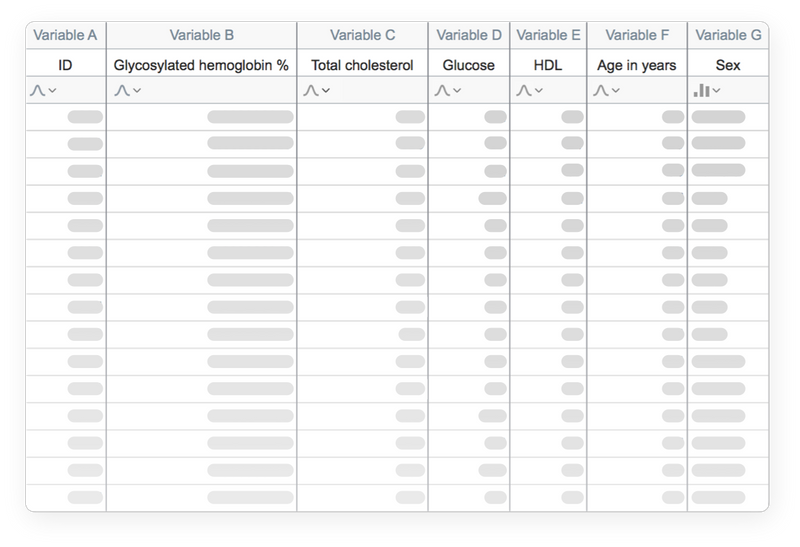
Organize Your Data Effectively
Prism is specifically formatted for the analyses you want to run, including analysis of quantitative and categorical data. This makes it easier to enter data correctly, choose suitable analyses, and create stunning graphs.
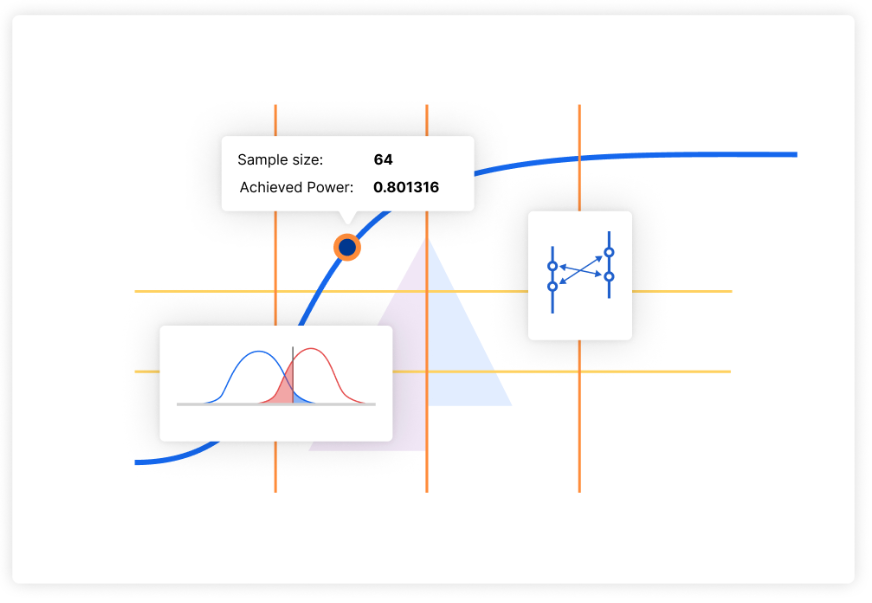
Sample Size and Power Analysis
Optimize your experiments from the start by accurately determining the necessary sample size for your predicted effect, or investigate the smallest effect you can detect given a limited sample size.
Streamline your research process, conserve valuable resources, and boost the reliability of your findings.
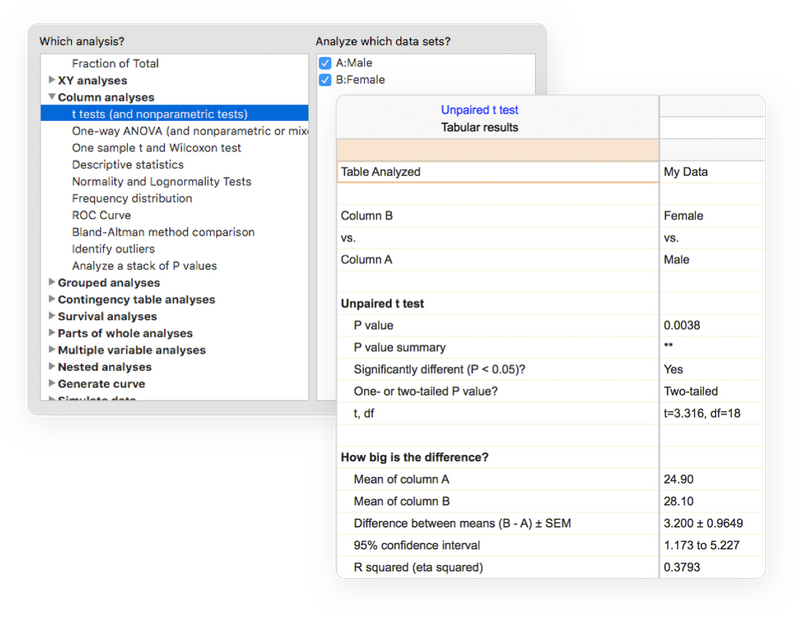
Perform The Right Analysis
Avoid statistical jargon. In clear language, Prism presents an extensive library of analyses from common to highly specific— t tests, one-, two- and three-way ANOVA,linear and nonlinear regression dose-response curves, binary logistic regression, survival analysis, principal component analysis, and much more. Each analysis has a checklist to help you understand the required statistical assumptions and confirm you have selected an appropriate test.
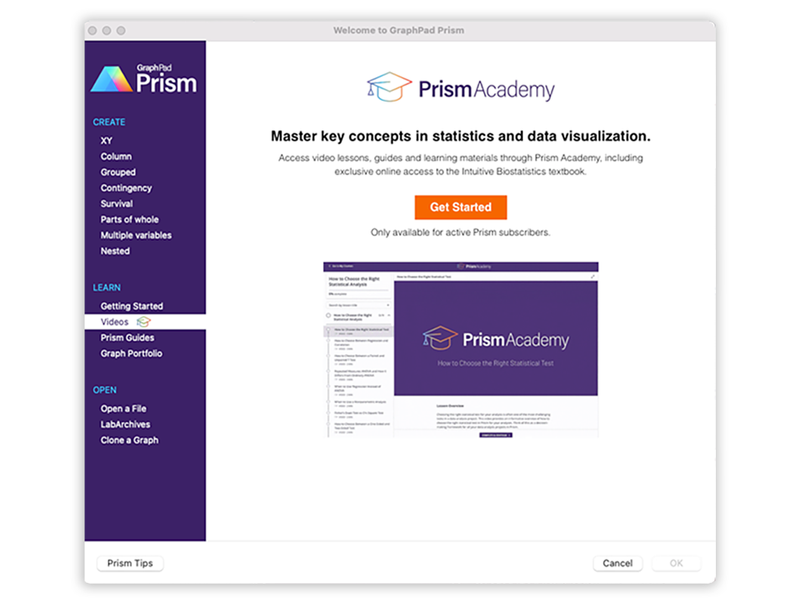
Get Actionable Help As You Go
Reduce the complexity of statistics. Prism’s online help goes beyond your expectations. At almost every step, access thousands of pages from the Prism User Guides. Learn from video lessons, guides and educational materials through Prism Academy. Browse the Graph Portfolio and learn how to make a wide range of graph types. Tutorial data sets also help you understand why you should perform certain analyses and how to interpret your results.
Work Smarter, Not Harder
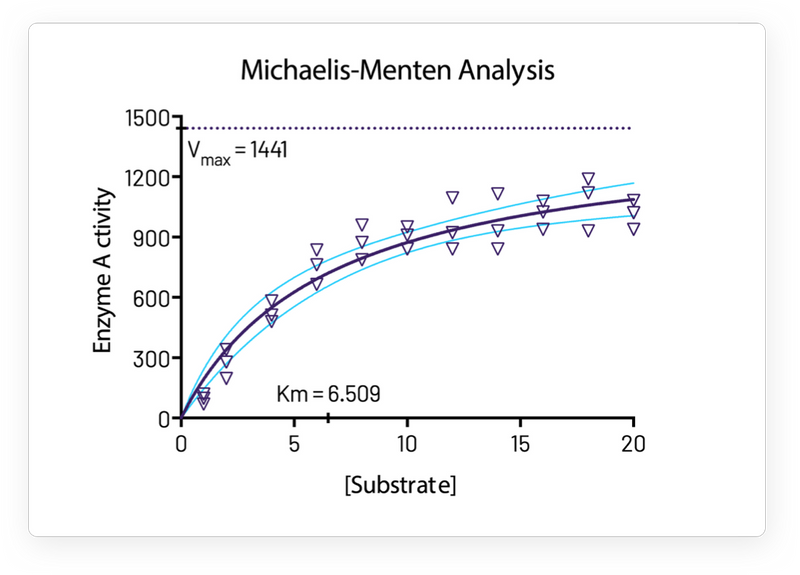
One-Click Regression Analysis
No other program simplifies curve fitting like Prism. Select an equation and Prism does the rest—fits the curve, displays a table of results and function parameters, draws the curve on the graph, and interpolates unknown values.
Focus on Your Research, Not Your Software
Prism handles the coding for you. Graphs and results are automatically updated in real time. Any changes to the data and analyses— direct entry of data, omitting erroneous data, correcting typos, or changing analysis choices—are reflected in results, graphs, and layouts instantaneously.
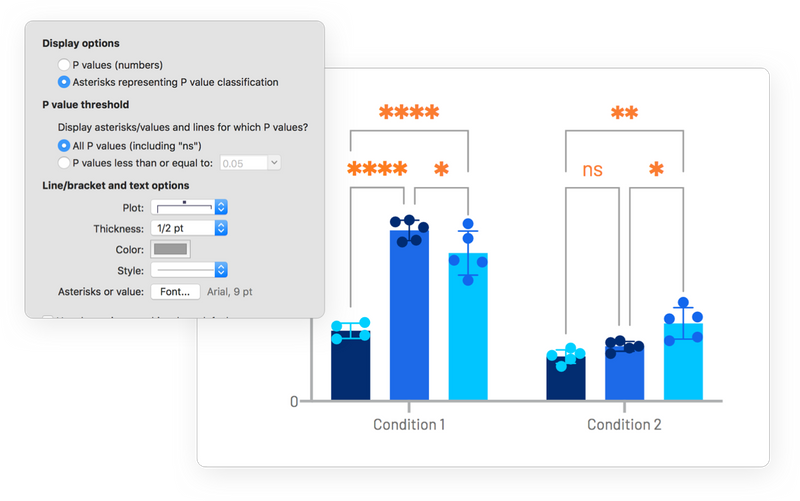
Automate Your Work Without Programming
Automatically add multiple pairwise comparisons to your analysis with a single click. For customization options of these lines and asterisks, simply click the toolbar button again. Make adjustments to the data or the analysis, and the results displayed on the graph will update automatically.
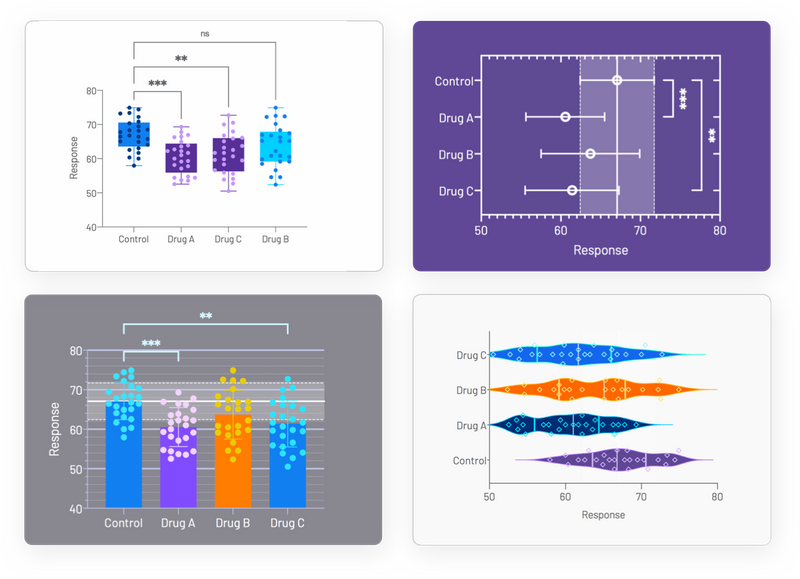
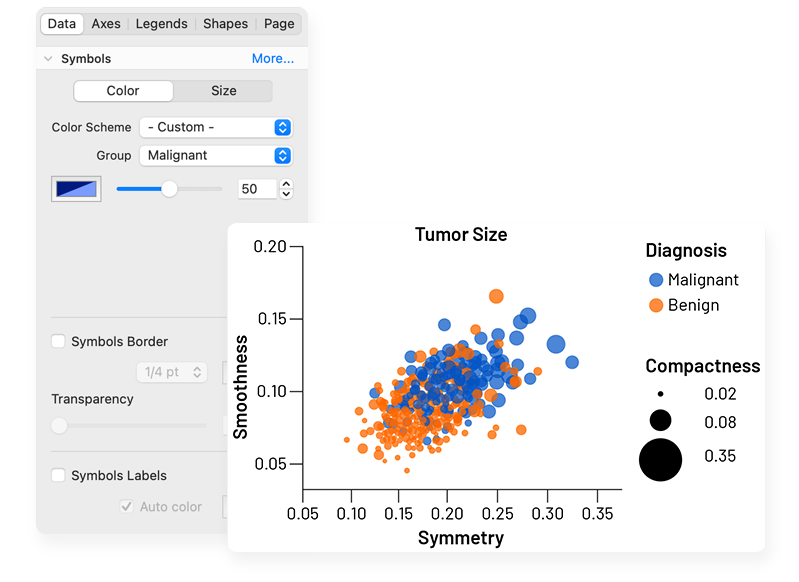
Countless Ways to Customize Your Graphs
Explore countless ways to present a single data set. Select the visualization style that most clearly tells the story contained within your data. Simply choose a graph type, then customize it in real-time with changes to how the data are arranged, the style of the data points, labels, fonts, colors, and much more. The customization options are endless.
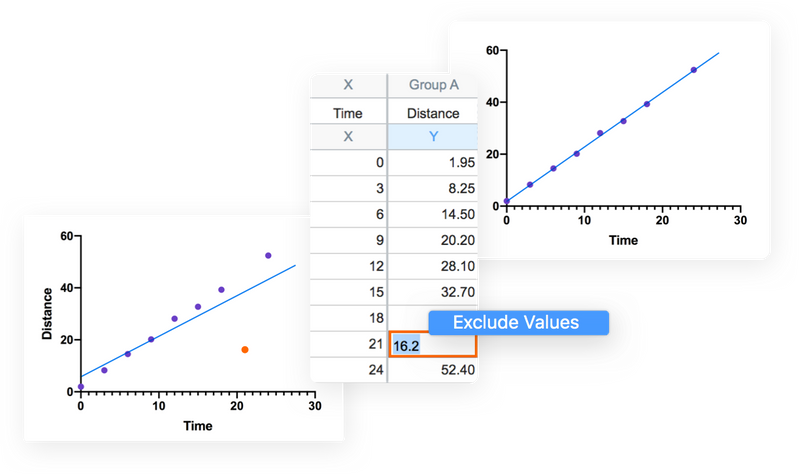
Explore Your Data
Focus your efforts on analyzing the most relevant data. Customize how you present the relationships in the data to effectively explore large data sets. Notice something interesting? Highlight a single data point to explore its corresponding properties. With Prisms' robust data wrangling capabilities, you can both save time and ensure that your analysis is based on clean and well-structured data.
Export Publication-Quality Graphs With One Click
Reduce time to publish. Prism allows you to customize your exports (file type, resolution, transparency, dimensions, color space RGB/CMYK) to meet the requirements of journals. Set your defaults to save time.
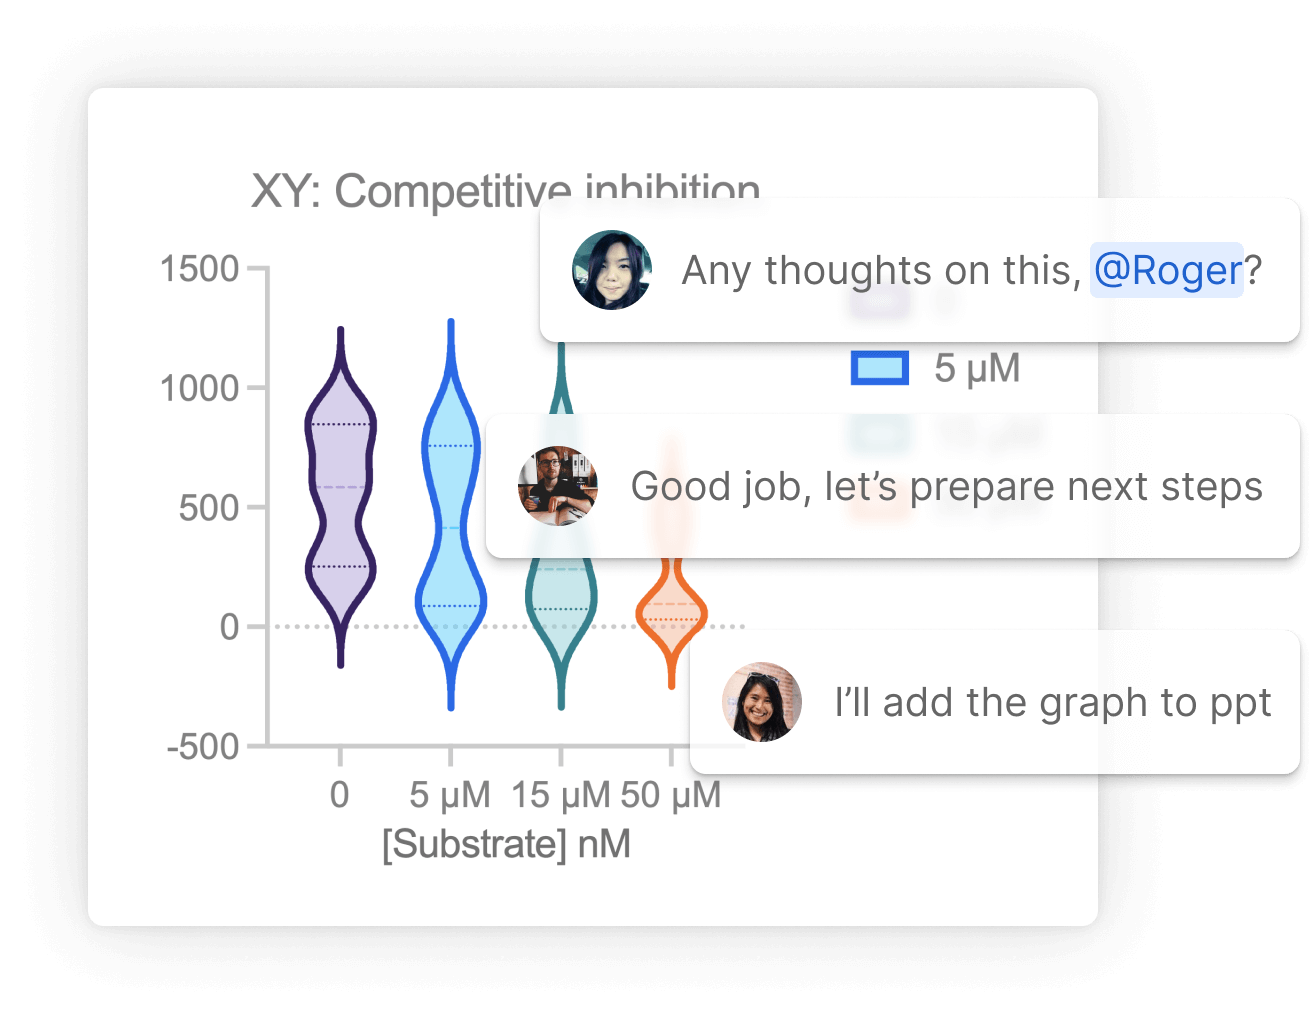
Collaboration. Simplified.
Avoid those messy email threads and use Prism Cloud to share, view and collaborate on your Prism projects. Safeguard the interoperability and reusability of your results with Prism’s open access file format. By using industry-standard formats (CSV, PNG, JSON, etc.), you can ensure that your projects can be utilized outside of Prism to open up new possibilities for your data workflows and integrations.
Discover What’s New in Prism!
Introducing an even more powerful Prism featuring enhanced data visualization and graph customization, more intuitive navigation, and more sophisticated statistical analyses.
Enhanced Data Visualization and Graphs Customization
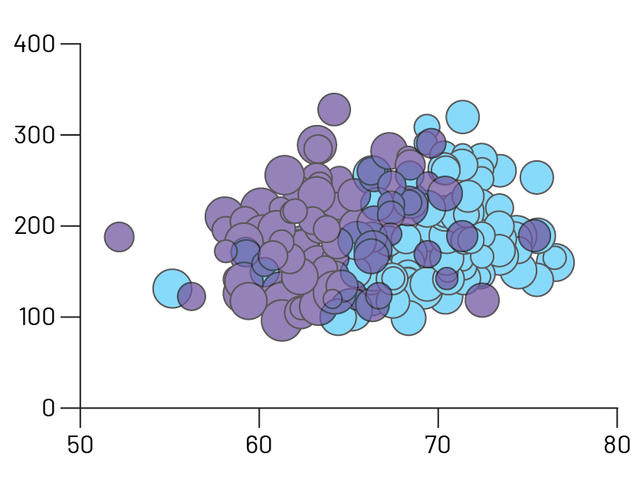
Bubble Plots
Create Bubble Plots directly from raw data, encoding variables for position (X- and Y-coordinates), color, and size
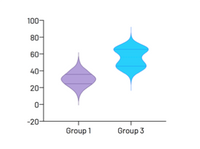
Violin plots
Visualize distributions of large data sets with either extended or truncated violin plots
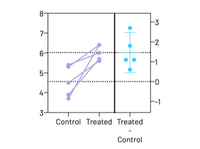
Estimation Plots
Automatically display your analysis results
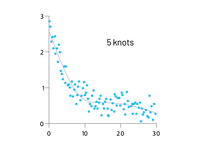
Smoothing spline
Major improvements in showing general data trends through Akima splines and smoothing splines with improved control over the number of knots, or inflection points
Improved Graphing and Customization Options
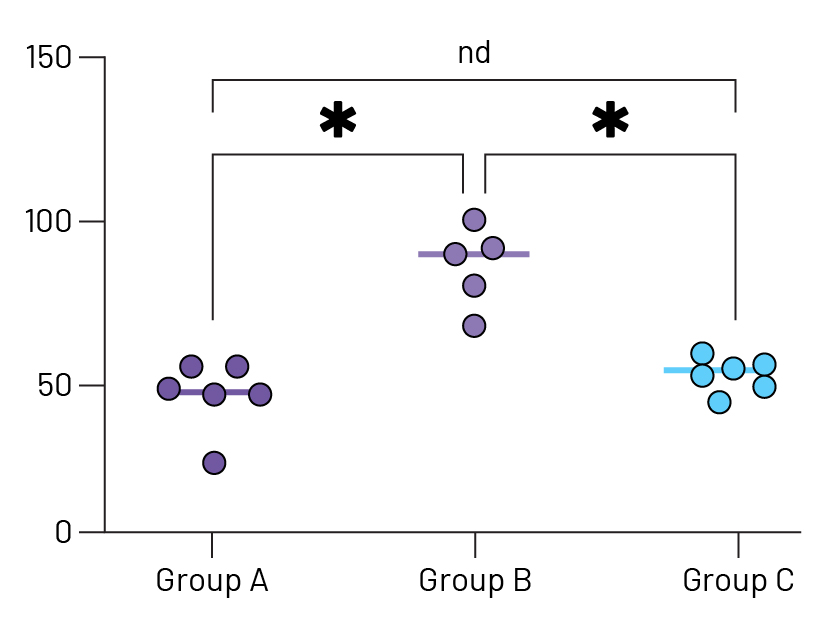
Stars on Graph
Automatically add multiple comparison results to graphs. Choose from a variety of P value summary styles including a responsive method appropriate for any alpha level
Improved Graph Customization
Craft stunning Bubble plots faster, easier, and more intuitively than before. Interact and customize graphs from your Multiple Variables data in real-time
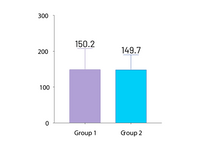
Automatically label bar graphs
Annotate your bar graphs with values for the means, medians, or sample sizes to emphasize what's important in your work
Improved grouped graphs
Easily create graphs that show both individual points (scatter) along with bars for mean (or median) and error bars

More Effective and Efficient Research
Greater Collaboration
Use Prism Cloud to avoid those messy email threads. Keep all of your discussions in one place while securely controlling who has access to your work
A More Open Access File Format
By using industry-standard formats (CSV, PNG, JSON, etc.), you can ensure that your projects can be utilized outside of Prism and open up new possibilities for your data workflows and integrations
Expanded Data Table Capabilities
You can have as many windows open as you need and data in up to 2048 columns, with 512 sub columns in each. Expanded analysis constant dialog allows you to link to more results for all types of analyses
Intelligent Data Wrangling
A new range of tools to help prepare your data for analysis. Covering multiple variables data tables, select and transform analysis and extract and rearrange functionality
Hook Constant Dialog Upgrade
A convenient way to establish connections between different elements in Prism. A new easy-to-navigate tree structure now covers the entire library of Prism analyses
Featuring Eight Kind of Data Tables
XY tables
Used when every data point is defined by a single X and Y value. These sorts of data are often fit with linear or nonlinear regression models.
Column tables
Used for data organized into groups by a single grouping variable (for example Treatment vs. Control or Female vs. Male). Often analyzed using t tests and one-way ANOVA.
Grouped tables
Used for data organized into groups by two grouping variables (for example Female Control vs. Female Treatment vs. Male Control vs. Male Treatment). Often analyzed using two-way ANOVA.
Contingency tables
Used for count data organized into groups by two grouping variables (Treatment vs. Control and Positive vs. Negative Outcome). Appropriate for analysis by Chi-square and Fisher's exact test.
Survival tables
Used to perform Kaplan-Meier survival analysis. Each row represents a subject or individual with elapsed survival time and outcome.
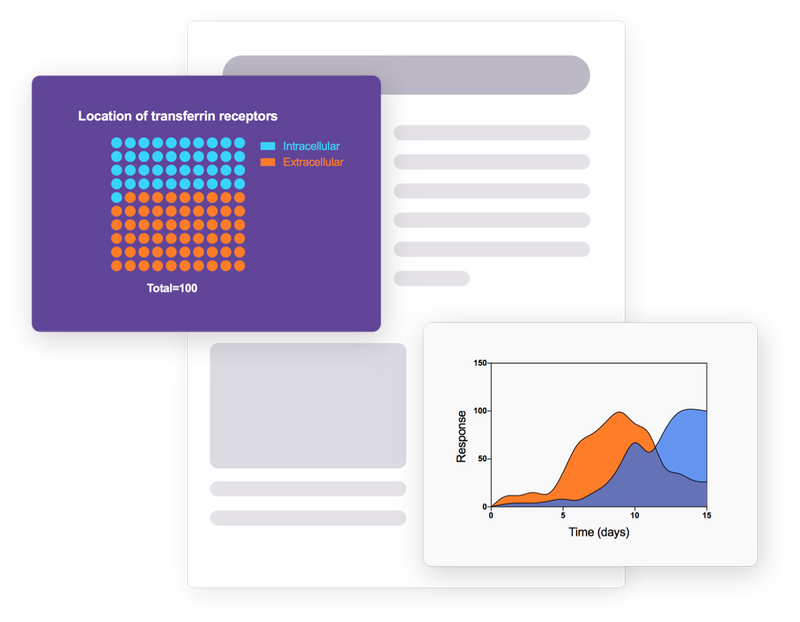
Parts of whole tables
Used when it makes sense to ask: "What fraction of the total is each value in the table?". Used for calculating fractions and generating pie charts.
Multiple variables tables
Used when each row of the data is a different observation and each column is a different variable and supports text values. Can be analyzed directly with multiple linear regression, Cox regression, and others or restructured into one of Prism's other table types.
Nested tables
Used when the data are organized into hierarchical groups. Analyzed using nested t tests or nested one-way ANOVA.
More Sophisticated Statistical Analyses
Perform repeated measures ANOVA – even with missing data
Now Prism will automatically fit a mixed effects model to complete this analysis
Perform simple and multiple logistic regression
Fit a model to a binary outcome (yes/no, win/lose, pass/fail) based on one predictor variable (simple logistic regression) or many predictor variables (multiple logistic regression)
Principal Component Analysis (PCA)
Calculate and select the principal components that describe the greatest amount of variance in your data. Choose from selection techniques including Parallel Analysis via Monte Carlo simulation, Eigenvalue threshold, Proportion of Variance threshold, and more
Multiple t test (and nonparametric) analyses
Perform multiple independent two-sample comparison tests simultaneously. Select from parametric/nonparametric tests, and specify if data are unpaired/paired
Analyze categorical variables with text in Multiple Linear and Multiple Logistic Regression
No coding required! Prism will automatically encode categorical variables and perform the analysis. Specify a reference and organize all levels of categorical variables in a model for clear, readable results
Interpolation from multiple linear and multiple logistic regression
Use the specified model to predict values for the dependent variable based on data in the data table or using theoretical values specified in the analysis
Statistical Comparisons
Nonlinear Regression
Survival Analysis
Principal Component Analysis
Multiple Variable Graphing
Column Statistics
Simple Linear Regression and Correlation
Generalized Linear Models (GLMs)
Clinical (Diagnostic) Lab Statistics
Simulations
Other Calculations

© Copyright 2000-2026 COGITO SOFTWARE CO.,LTD. All rights reserved
