
UVexplorer
Key Features
Automatically and quickly discover information about the devices on your network and the connections between them.
To manage your IT infrastructure effectively you must know what devices are on your network and how they are connected. UVexplorer is one of the fastest, most detailed network discovery solutions on the market today. Using industry-standard protocols such as SNMP, WMI, and SSH, UVexplorer automatically and quickly scans your network to find all devices that are connected to your network.
This includes routers, switches, servers, workstations, printers, wireless access points, virtual machines, and much more. Detailed information is collected about each discovered device including: IP and MAC addresses, system and OS information, serial numbers, network interfaces, installed software, route tables, etc. UVexplorer also discovers the physical and logical network connections between your devices. When discovery is complete, you can browse the devices on your network, and drill down into the details about each one. You can run reports on the collected data to get a comprehensive view of what's on your network. You can also view detailed network maps to visualize the physical and logical structure of your network. This comprehensive view of your network enables you to manage it effectively. Additionally, using UVexplorer's Automatic Scheduled Discoveries, you can keep your discovery results constantly up-to-date.
For PRTG Network Monitor Users.
You can quickly and easily export discovered device information and network maps from UVexplorer into PRTG Network Monitor. UVexplorer can also automatically create PRTG sensors on devices when they are exported into PRTG. Combining UVexplorer's fast network discovery, detailed device information, and automatic network maps with PRTG's advanced monitoring capabilities results in a powerful network management platform.

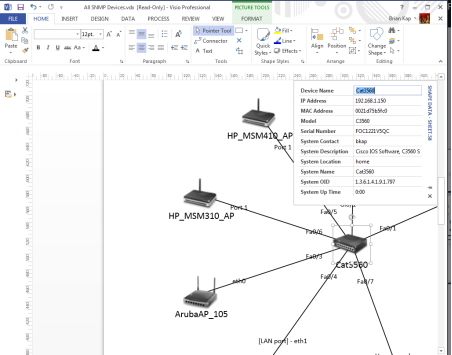
Create network maps for documentation, meetings, and presentations, sharing with your boss, or hanging on the wall. Export UVexplorer's automated network maps to Microsoft Visio™, PDF, and SVG documents.
Graphical network maps are essential when managing complex IT infrastructure. Many IT professionals create and maintain complex network diagrams using Microsoft Visio™ or similar drawing tools. Manually maintaining these diagrams is a lot of work. Fortunately, UVexplorer can do this work for you automatically. Through its Automatic Network Maps feature, UVexplorer automatically creates network maps, and keeps them up-to-date with the latest discovery results.
Even with UVexplorer’s powerful network mapping capabilities, it is often necessary to use network diagrams outside of the UVexplorer environment. For example, you might want to print out a network diagram to hang on your office wall. Or, you might need to include a network map in a PowerPoint™ presentation to be given in a meeting. Or, you might want to share a network diagram with a co-worker who does not have the UVexplorer software.
For these and similar situations, UVexplorer makes it easy to export network maps to Microsoft Visio™, PDF, or SVG documents. Exported Visio documents include detailed device information as “shape data”. Once a map has been exported to one of these document formats, it can be easily printed, archived, or shared with others.
Monitor the status of critical devices and services on your network. Receive notifications when problems arise. Track your network's performance using UVexplorer's Ping monitors, CPU monitors, Disk monitors, Web Site monitors, and much more.
As an IT administrator you have limited "bandwidth" to watch over your IT infrastructure. UVexplorer can increase that bandwidth by intelligently monitoring critical IT resources while you tend to more pressing matters. With UVexplorer you can monitor the critical devices and services in your IT infrastructure, and receive notifications when unexpected outages or performance problems occur. UVexplorer provides a wide range of monitors that you can create, including:
With these monitors, UVexplorer gives you visibility into the current state of your network and alerts you about areas of trouble.

Get detailed inventory data and reports for your devices. View system information, serial numbers, IP/MAC addresses, host names, installed software, network interfaces, network connections, route tables, ARP caches, BIOS information, and much more.
UVexplorer collects detailed inventory data about your devices and network. It contains device-specific collection techniques to find all the data you will need to create comprehensive asset reports for your IT infrastructure. Just some of the most basic reports include:
Device inventory includes the following data, when it can be determined:

Inventory Reports
In addition to viewing individual device data, UVexplorer also lets you run a number of inventory reports across all the devices on your network. The following reports are available:
Asset/Inventory Report - Displays serial number, model, hardware version, software version, firmware version, and IP address of devices on your network.
Device Connectivity Report - Displays physical (i.e., Layer-2) network links between devices on your network.
Software Report - Displays software packages installed on the devices on your network.
Processes Report - Displays processes (i.e., programs) currently running on the devices on your network.
MS Windows Reports - Displays WMI information for all of your MS Windows devices, including Computer Systems, BIOS, Operating Systems, Processors, Disk Drives, and Logical Disks
For PRTG Network Monitor Users.
You can quickly and easily export discovered device inventory data from UVexplorer into PRTG Network Monitor. UVexplorer's device inventory data can be viewed directly inside PRTG's web console
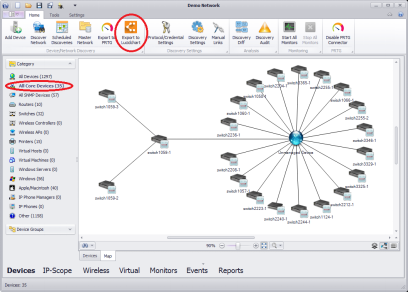
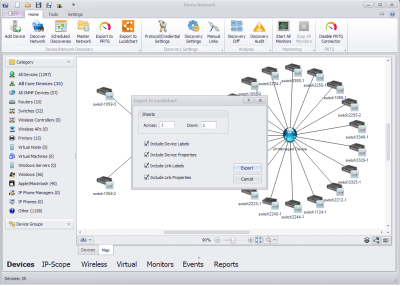
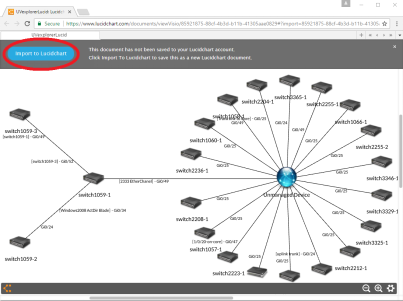
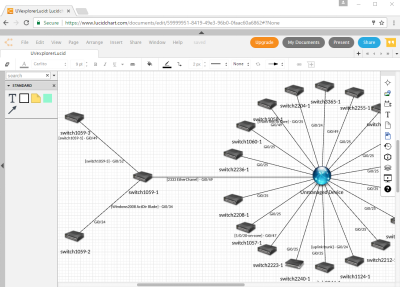
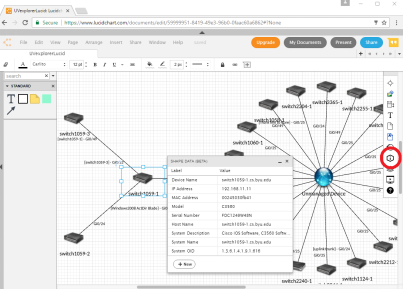
Export UVexplorer network maps into Lucidchart. Lucidchart is a collaborative, web-based diagramming application that allows users to share, view, and collaborate on diagrams. By exporting network maps into Lucidchart, UVexplorer users can leverage Lucidchart's advanced diagramming capabilities to enhance their network diagrams, as well as publish and store their maps in a central location accessible to their co-workers.
Lucidchart is a collaborative, web-based diagramming application that allows users to share, view, and collaborate on diagrams. By exporting network maps into Lucidchart, UVexplorer users can leverage Lucidchart's advanced diagramming capabilities to enhance their network diagrams, as well as publish and store their maps in a central location accessible to their co-workers.
To export a network map and all related device details to Lucidchart, do the following:
Receive automatic notifications when important changes occur on your network. Be the first one to know when important devices appear or disappear on your network, and when your network topology changes.
As an IT professional you have lots of responsibilities and things to think about. You need to know what’s happening on your network, but you can’t be everywhere at once. Or can you? Let UVexplorer monitor your network for you and notify you about important events that occur in your network.
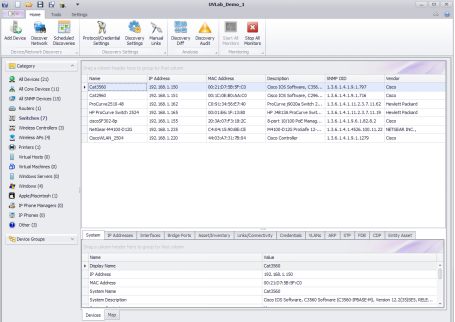
Discovery Results with UVexplorer
Each time UVexplorer discovers your network, it creates a "discovery result" which captures a complete snapshot of your network's current state. This includes all devices on the network, device inventory data, and connections between devices right down to the switch port. Each discovery result is stored in UVexplorer’s database. Because over time it creates multiple snapshots of your network’s state, UVexplorer is able to detect changes in your network by comparing the current state with the prior state.
For example, UVexplorer can detect when devices appear or disappear on the network, and notify you of this event. Similarly, when the network's connectivity changes (i.e., links created or removed), UVexplorer can detect the change and notify you. You can view the differences between any two discovery results in your database.
Additionally, UVexplorer’s Scheduled Discoveries feature lets you configure a scheduled discovery to notify you of important network changes. Each time a scheduled discovery completes, it compares the current state of the network to the prior state, and notifies you of any important changes that occurred in between.
Automatically create network maps that display connections between your network devices right down to the port-level. Use network maps to monitor the status of devices on your network.
When it comes to network management, an accurate and up-to-date device map is an IT manager’s dream. Networks can be complex, and being able to see them in a graphical format is critical for understanding, managing, and monitoring a network effectively.
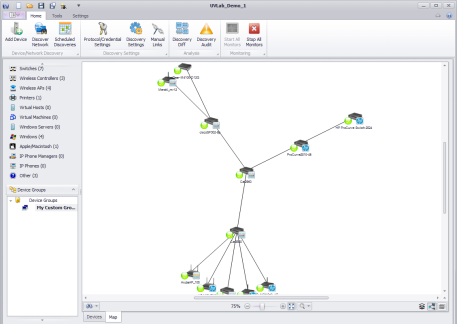
Visualize Your Network
UVexplorer lets you visualize your IT infrastructure with network connectivity maps, including physical port-level connectivity. It also shows the logical relationships between devices in your network, such as those used to manage virtual machines, wireless access points, and IP phones. UVexplorer has the intelligence to gather detailed connection and topology information for any type of environment. Whether it is wired, wireless, or virtual, UVexplorer automatically generates the maps you need to “see” everything on your network.
Never Create Network Maps By Hand Again
There is no need to create network maps by hand, and your maps are always up-to-date with the latest discovery results. UVexplorer automatically generates network maps for a variety of pre-defined device groups (routers, switches, printers, servers, etc.). You can also create custom network maps to visualize any part of your network or group of devices that you desire.
UVexplorer can automatically organize the devices on a map using its built-in map layout algorithms, or you can manually position devices on a map to achieve exactly the look you want. Additionally, using Automatic Scheduled Discoveries, UVexplorer will keep your network maps constantly up-to-date with the latest discovery results.
UVexplorer's network maps also work hand-in-hand with its built-in device monitoring capabilities. To help you monitor the health and performance of your network, UVexplorer displays monitoring status information directly on its network maps, thus making it easy to see when potential problems exist in your network.
For PRTG Network Monitor Users
UVexplorer’s network maps can easily be exported into PRTG Network Monitor. Rather than creating PRTG maps by hand, you can instead use UVexplorer to automatically discover and map your network, and then export UVexplorer network maps into PRTG to create PRTG maps. In the opposite direction, in UVexplorer you can create PRTG Monitors that import device status information from PRTG into UVexplorer. This allows you to display device status information from PRTG on UVexplorer network maps. In this way, the combination of UVexplorer and PRTG Network Monitor results in a powerful network management platform.
Manage and monitor your wireless network infrastructure. Know who is on your wireless network. Detect rogue access points. Receive notifications when your wireless infrastructure changes.
Wireless devices are ubiquitous, and wireless network access is an essential part of most corporate networks. Along with the great convenience of wireless networking comes a host of security and management challenges. Wireless access points must be configured. Wireless LAN controllers must be managed. Users can connect unauthorized (rogue) wireless access points to the network, which creates serious security concerns. The list goes on and on.
With UVexplorer you can easily discover your wireless networking infrastructure, including wireless LAN controllers, wireless access points, and wireless clients. You can detect unauthorized (rogue) wireless access points that have been connected to your network.
With UVexplorer’s Automatic Network Maps, you can also visualize your wireless network infrastructure, and even export maps to Microsoft Visio™, PDF, and SVG documents. You can monitor the health and performance of your wireless network using UVexplorer’s built-in monitoring capabilities. Or, if you use PRTG Network Monitor to monitor your network, you can export wireless device information and network maps to PRTG .
Analyze and solve network and device problems with UVexplorer's suite of diagnostic tools. Find rogue IP/MAC addresses on your network, run Layer-2 traces, analyze real-time network interface performance, and much more.
IT professionals need tools that help them diagnose and fix problems that occur in their networks. Devices become overloaded or go down. Network links become saturated or broken. Device configurations get lost or modified. Critical services go down.
UVexplorer provides a suite of diagnostic tools to help you quickly find the root cause of a problem, and get it resolved. The following tools come built-in with UVexplorer:
IP/MAC finder: Search your network to learn what device(s) a specific IP or MAC address belongs to. For example, if a device with a particular MAC address is consuming too much network traffic, this tool can show you which device that MAC address belongs to.
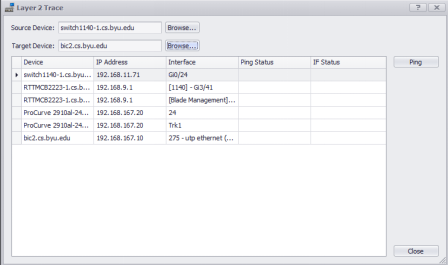
Layer-2 Trace: Trace the hop-by-hop network path between any two devices in your network. This tool can provide insight into why a device might not be reachable from another device on the network.
Start vs. Run Config Comparison: View the differences between the “starting” and “running” configurations of a network device, such as a switch or router. This tool can show you what changes have been made to a device’s configuration since it booted, but have not been saved to its “starting” configuration.
Capture Config: Backup the “starting” and “running” configurations of a network device, such as a switch or router. Keeping backups of device configurations allows you to restore device configurations in the event that a device’s configuration becomes corrupt or lost.
DNS/Hostname Audit: Test and verify your DNS server’s configuration. Given an IP address range, it performs both forward and reverse DNS lookups, and shows you the results. You can scan the results for potential problems.
SNMP MIB Walker: Browse a device’s SNMP MIB values. Use this tool to learn about a device’s operation, or to diagnose problems that might exist with the device.
PING Status: Send a series of PING requests to one or more devices, and view a graph of each device’s response (RTT) times.
CPU Load Test: Plot the CPU load for one or more devices over a period of time. This tool helps you measure the load that each device is under, and whether a device might be overloaded and thus unable to function properly.
Real-Time Interface Status: View statistics for all of the network interfaces on a selected device. This tool displays all of the network interfaces on the selected device, the speed and status of each interface, and also inbound and outbound network traffic statistics.
Together, these tools provide a powerful toolkit with which to analyze and understand your network.
Use scheduled discoveries to keep your discovery results constantly up-to-date. Receive notifications when important devices come or go on your network, and when network links change.
Your network is constantly changing. Devices constantly join and leave the network. Device performance fluctuates. Network links between devices are reconfigured. To keep up with these changes, you need to discover your network on a regular basis (every week, every day, every hour, etc.).
To make it easy to re-discover your network on a regular basis, UVexplorer lets you create "scheduled discoveries". A “scheduled discovery” is a discovery that runs on an automated, scheduled basis (e.g., every day at 5pm), and automatically stores the results of the discovery in UVexplorer's database. You can specify whatever schedule you want. This will ensure that your discovery results are always up-to-date and reflect the current state of the network.
If you like, you can configure your scheduled discoveries to send email notifications when significant changes occur in your network. Specifically, you can be notified when devices join or leave the network, and also when network links between devices are modified. This way, if someone makes unauthorized changes to your network, you will know about it.
For PRTG Network Monitor Users
If you export device information and network maps from UVexplorer into PRTG Network Monitor, you probably want to ensure that the exported data is always up-to-date and current. Automatic scheduled discoveries can be used to keep your PRTG device information and network maps always up-to-date. When a scheduled discovery completes, it will re-export the new discovery results into PRTG, augmenting and replacing previously exported data with the latest discovery results.
Manage and monitor your virtual IT infrastructure. Discover VMware and Hyper-V virtual machines, virtual hosts, virtual servers, and virtual switches. Visualize you virtual assets with UVexplorer's automatic network maps.
Much of our IT infrastructure is now virtual. Software applications are deployed on virtual machines using virtualization platforms such as VMware and Microsoft Hyper-V. Virtual machines are deployed and managed on virtual hosts. Virtual machines are connected to networks through virtual switches.
Specifically, it knows how to discover VMware virtual machines, VMware ESX/ESXi virtual hosts, and VMware vCenter servers. It can also discover Microsoft Hyper-V virtual machines and virtual hosts. For all of these UVexplorer provides detailed device inventory data as well as accurate link-level network maps.
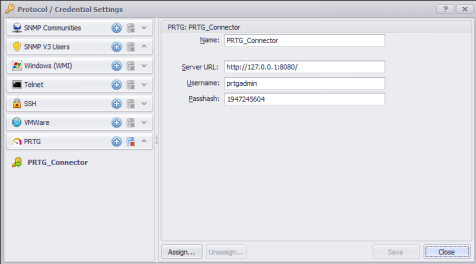
Optimize Your PRTG Experience
With UVexplorer's PRTG Connector, add powerful network discovery, detailed device inventory, and automatic network maps to PRTG Network Monitor.
Cost-Effective Network Management
UVexplorer is a powerful and affordable network management solution. Pay far less than you would for competing solutions.
UVexplorer is priced to be affordable by virtually any IT organization. Despite its low cost, UVexplorer's core features are as good or better than corresponding features in other network management products that are 10 to 50 times more expensive.
UVexplorer's network discovery is best-of-breed. UVexplorer’s ability to capture and archive snapshots of a network's state, and to detect changes in a network are unsurpassed. UVexplorer's network visualization and mapping capabilities are superior to most other network management products.
Indeed, UVexplorer is highly capable and cost-effective. UVexplorer even has a free version that can be used at no cost. Some important features are unavailable in the free version, but it is still an option for those with super-tight budgets.
UVexplorer also integrates with PRTG Network Monitor, an enterprise-grade network monitoring solution from Paessler. UVexplorer's strengths of superior network discovery, automatic network mapping, and network change detection are the perfect complement to PRTG's advanced network monitoring capabilities. The combination of UVexplorer + PRTG Network Monitor results in a cost-effective, highly capable network management platform.
Capture detailed device and network inventory information to help meet documentation requirements of governmental regulations like PCI, HIPAA, FISMA, SOX, etc.
Regulatory Compliance
Governmental regulations like PCI, HIPAA, FISMA, and SOX require organizations to document the details of their IT infrastructure to demonstrate that sensitive enterprise data is properly secured and being managed according to industry best-practices. Each time UVexplorer discovers your network, it creates a “discovery result” which captures a complete snapshot of your network’s current state.This includes all devices on the network, detailed device inventory data, and connections between devices.
Each discovery result is stored in UVexplorer’s database and archived indefinitely. Historical discovery results can be used to show what your network’s configuration was at any given point in time. You can also run reports on this data to produce the information needed to demonstrate compliance with governmental regulations.

With UVexplorer's PRTG Connector, configure and maintain multiple PRTG servers from one central UVexplorer repository.
PRTG Network Monitor is a popular network monitoring platform that can be streamlined and optimized to target just what you need for simple and accurate network monitoring. However, your IT infrastructure is ever growing and changing. Keeping your PRTG server configuration up-to-date with those changes can be a difficult, if not overwhelming, task. For example, each time critical devices are added to your network, new sensors need to be created. And, if you need to distribute the monitoring load among multiple PRTG servers, the task of keeping your PRTG server configurations up-to-date is even more challenging.
With UVexplorer's PRTG Connector, you can control one or many PRTG Network Monitor servers from one UVexplorer console. By simply creating PRTG Connector targets, you can connect UVexplorer to as many PRTG servers as you want.
So, now that multiple servers are up and running, how can you see the overall status of your network devices? With UVexplorer, this is simple. UVexplorer can be configured to “monitor” device status from one or many PRTG servers. By creating a PRTG Status Monitor, UVexplorer can be “linked” to devices that are monitored on any of your PRTG Network Monitor servers. This monitor will allow UVexplorer to pull device status directly from PRTG and display that status within the UVexplorer console. The device status imported from PRTG is automatically displayed on UVexplorer’s network maps, as well as in other views within the UVexplorer user interface. A device’s status can be configured to reflect a roll-up of all the device’s PRTG sensors, or to reflect a select subset of the device’s PRTG sensors. This allows you to view device status from multiple PRTG servers within a single UVexplorer console.
Backup the configurations of your network devices, such as routers, switches, and firewalls. Track how device configurations change over time. Access backed-up device configurations when you need to restore failed devices, or configure devices for the first time.
Network devices such as routers, switches, and firewalls have intricate configurations that are labor-intensive to set up. It is common that device configurations become corrupt or lost. For example, a network engineer might make a bad change to a device's configuration. Or, a power surge or hardware failure might cause a device's configuration to be corrupted or lost entirely. For situations such as this, it is critical that you backup your network device configurations so you can restore them later if necessary. Fortunately, UVexplorer has the ability to discover and backup device configurations for many (but not all) kinds of network devices. Any time UVexplorer discovers your network, you can ask it to include device configurations as part of the data it discovers. Doing this will effectively back up your device configurations in case you need to restore them later.
UVexplorer also provides a "Capture Config" tool that allows you to manually backup your device configurations without doing a full discovery of your network. Either way, UVexplorer has your back when it comes to safeguarding your network device configurations.


© Copyright 2000-2026 COGITO SOFTWARE CO.,LTD. All rights reserved
