What's New in Surfer 22
There are a ton of awesome new features in the latest release of Surfer! We focused on increasing processing speed, optimizing workflows to maximize your efficiency, and we included a lot of exciting new features as well. The top new features are listed below.

MAPPING IMPROVEMENTS
New map type! Create a Drillhole map
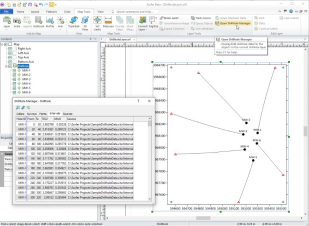
A powerful new visualization tool, Surfer easily imports drillhole data to generate a 2D drillhole layer that shows the location, deviation, and path of each hole, core, or well. Manage your data in the brand new Drillhole Manager. You can view the path in a 2D map view and then visualize the drillhole in true 3D!

Visualize your drillhole data using the brand new drillhole layer type, and manage data in the Drillhole Manager!
3D VIEW IMPROVEMENTS
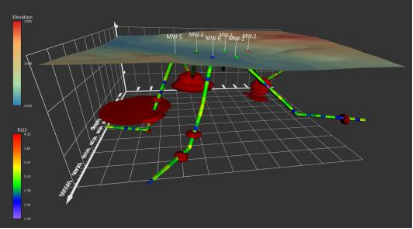
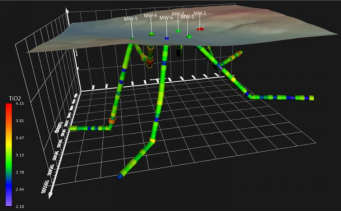
Model your Drillhole map in true 3D
Take Surfer’s brand new map type, the Drillhole layer to the next level by viewing in the 3D View! In the 3D View your well data comes to life with the ability to visualize the wells in true 3D along with its data content (e.g. contaminant concentration, mineralization concentration, assay results, geophysical properties, etc.) Drillhole paths, data points and intervals can be displayed and colorized by data values.

After you've created your drillhole map, visualize the data and its components in a true 3D environment.
New symbol type for 3D vector data
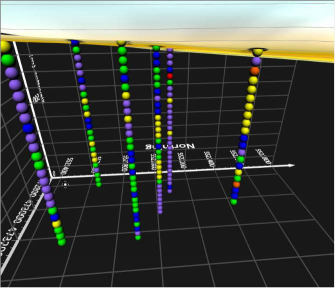
There is a new symbol type for view point vector data: the sphere. This symbol is a true 3D sphere (like the Cube symbol), which looks good at all angles, even when intersecting surfaces. In previous versions of Surfer, there was a symbol named Sphere, but was in reality a flat 2D circle that is shaded to appear 3D. This flat symbol is still available and has been renamed Shaded circle.

Use the new 3D symbol, the Sphere.
GEOPROCESSING
Introducing the Alpha Shape
Create a tight polygon boundary around data points in post, classed post and base layers or directly from any data file, even in concave areas. Control how tight the polygon is shrink-wrapped to the data limits. The boundary can be a convex hull or a concave hull with holes. Use the polygon boundary for assigning NoData or delineating coverage area.

The ability to create a tight polygon shape around data points is here!
Assign NoData outside of Alpha Shape
Delete areas in a grid file outside of an alpha shape directly in the Assign NoData, Grid Data, and Grid from Contours dialogs! The Alpha Shape allows you to create a tight polygon boundary around your data points, much like the existing Convex hull option. The Alpha shape can create a concave hull around data points and even gives you control on how tight the polygon clings around the data limits.

Use the brand new Alpha shape while gridding XYZ points, contour lines, or Assigning NoData.
GRID CALCULATIONS
Instant Isopach or Isochore Calculation
Surfer can now quickly and accurately measure the true stratigraphic thickness (isopach) or true vertical thickness (isochore) of a unit or layer regardless of its orientation with the brand new Grid Isopach tool! Use the Grid Isopach tool to measure the thickness of geologic horizons that have been tilted at any angle.

Use Grid Math and Grid Volume on grids with different grid geometry
Do you need to perform mathematical calculations using one or more grid files? Or determine the volume between an upper and lower grid surface? These calculations were always possible in Surfer but only between grid files with identical geometry – a rarity in the real world. Surfer now allows users to perform these calculations with grids of different sizes and different X and Y value extents! This tool also allow you to perform calculations on grids in varying coordinate systems.

Use Grid Math or Grid Volume on grids with varying grid geometries or coordinate systems!
© Copyright 2000-2025 COGITO SOFTWARE CO.,LTD. All rights reserved