We at AnyChart are glad to announce that the versions 7.12.0 of our JavaScript (HTML5) charting libraries AnyChart, AnyStock, AnyMap and AnyGantt are now available to download! The new releases bring even more flexibility and convenience to both the development and the UI of charts, stock and financial graphs, Gantt charts, and dashboards powered by our interactive data visualization solutions.
Are you ready to learn more on what's new? Let's go!

All Libraries
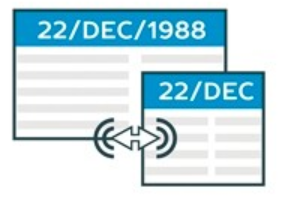
Localization Support in AnyChart AnyStock AnyMap and AnyGanttLocalization Support
Support of localization with the help of locale settings files and special formatting functions is one of the major additions to our JS charting libraries. This is not a big novelty for AnyGantt that first got it in early 2016. However, now you can make use of 196 different regional settings from our CDN to format date/time information in AnyChart, AnyStock and AnyMap libraries, too.
AnyChart
Scales, axes, legends - now you can use any of these core chart elements separately. This allows you to customize your charts in an advanced way (e.g. by introducing additional visual blocks) and build your own, unique visualizations (e.g. with the help of our GraphicsJS library for drawing).
Tooltip Settings Improved
Following the reconsideration of tooltips as such, we significantly improved them and extended the related parts of our API. Now you are welcome to enjoy the enhanced control over their appearance and behavior as well as to set individual tooltips for each series with great ease.
AnyStock
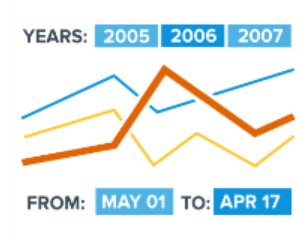
Range Selection UI in AnyStockRange Selection UI
Convenient navigation is a must-have for graphs visualizing large datasets. Keeping this in mind, we introduced a set of UI elements that you can use to add the range selection functionality. Now we offer the Range Selector featuring buttons for setting what period of time to display (N days, months, years, etc.), and the Range Picker with 2 input fields so a viewer can type in start/end dates.
AnyMap
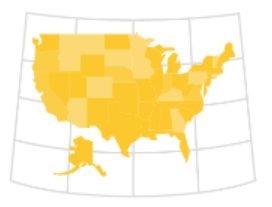
Map Grid in AnyMapMap Grid
To improve map reading and navigation, we added several important features to AnyMap. They allow you to fine-tune the display of your geo-related data so that viewers could define locations easier. One of them is the Map Grid object, a quick way to draw meridians and parallels on maps.

Map Axes in AnyMapMap Axes
The Map Axes object with latitude and longitude labels is another way to display parallels and meridians on a map. The Geo Scale that controls map grids and axes ensures that you get a great variety of looks and feels for map visualizations.
Map Crosshair in AnyMapMap Crosshair
As a visual position tracking element, the Map Crosshair is especially useful in visualizations intended for exploratory data analysis. It works nicely in conjunction with map grids and map axes, and is a great helper at identifying the precise location of a particular point.
AnyGantt
Brand New Resource Chart in AnyGanttBrand New Resource Chart (Beta)
We have always been doing our best to improve our products. This time we decided to take a fresh look at our Resource Chart. After studying how people manage various resources and what they want to get as the result, we completely redesigned the Resource Chart. And here is it - we are glad to present the beta version of our new Resource Chart that is available in AnyGantt 7.12.0.
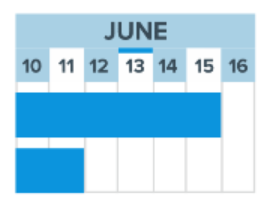
Calendar Support

Managing resources with the help of a resource chart gets easier when it is aware of your work schedule. This is why we added a calendar so you specify weekends, holidays, etc. Our calendar acts as an abstract mathematical entity and a special object allowing you to create and configure this entity. It does not have its own visual representation but is used by other elements.
Smart Timeline
The new Resource Chart features an improved, smart timeline that looks great with any data and adjusts the display of dates and times for an ideal fit to scale/zoom.

© Copyright 2000-2026 COGITO SOFTWARE CO.,LTD. All rights reserved
