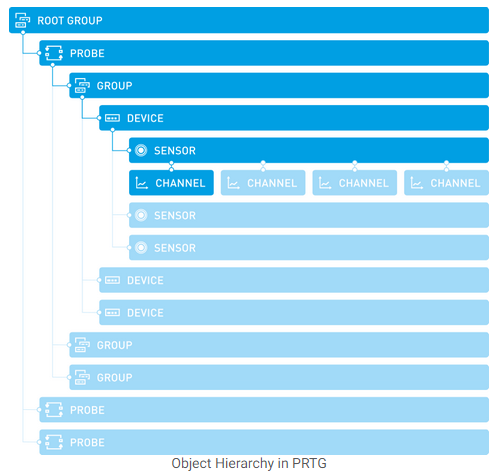
All objects in the PRTG monitoring configuration are arranged in a tree-like hierarchy. You can arrange the objects in groups that monitor similar devices, services, or particular locations. This hierarchical order is also used to define common settings for larger groups of objects. The settings of the root group, for example, apply to all other objects underneath in the hierarchy by default

The graph shows the object hierarchy in PRTG:
Root Group
The root group is the topmost instance in PRTG. It contains all other objects in your setup. We recommend that you adjust all default settings for the root group. This is because all other objects in the device tree inherit these standard settings by default. Thus, you do not have to set up the same configuration for each object anew.
Probe
Each group (except the root group) is part of a probe. This is the platform where the actual monitoring takes place. All objects that you add to a probe are monitored via that probe. For PRTG on premises, every PRTG core server installation automatically installs thelocal probe. For PRTG hosted by Paessler, every instance comes with the hosted probe.
In a cluster, there is an additional cluster probe that runs on all cluster nodes. Devices on the cluster probe are monitored by all cluster nodes, so that monitoring always continues, even if one of the cluster nodes fails.
You can add additional probes and remote probes to your configuration to also monitor remote devices from outside your network.
For more information, see section Multiple Probes and Remote Probes.
Group
On each probe, there are one or more groups that have structural purposes. Use groups to arrange similar objects so that they inherit the same settings. To a group, you add devices. You can arrange your devices in different nested groups to reflect the structure of your network.
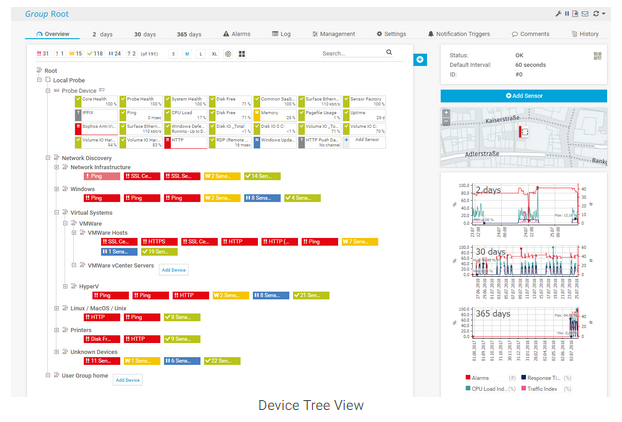
Here is a sample configuration of a device tree with the local probe, several groups, devices, and their sensors.

Device
You can add devices that you want to monitor to each probe or group. Each device in your configuration represents real hardware or a virtual device in your network. This can be, for example:
Sometimes you might want to add the same device several times to receive a better overview when you use a large number of sensors for very detailed monitoring, or to use different device settings for different groups of sensors. You can add multiple devices with the same IP address or Domain Name System (DNS) name. The sensors on all of these devices then query the same real hardware device in your network.
PRTG additionally adds the probe device to the local probe. This is an internal system device with several sensors. It has access to the probe system and monitors the system's health parameters.
PRTG automatically analyzes the devices that you add and recommends appropriate sensors on the device's Overview tab. In theRecommended Sensors table, click the Add These Sensors button in the corresponding table row to create recommended sensors with one click.
You can turn off the sensor recommendation in System Administration—Monitoring.
Sensor
On each device, you can create a number of sensors. Every sensor monitors one single aspect of a device. This can be, for example:
Channel
Every sensor has a number of channels through which it receives the different data streams. The available channels depend on the type of sensor. One channel can contain, for example:
© Copyright 2000-2026 COGITO SOFTWARE CO.,LTD. All rights reserved