LightningChart :3D Measurement and Development Data Visualization SDK| ChartManager control executes Chart interoperation, SignalGenerator is with complete function
of data acquisition
15. ChartManager component
Add ChartManager control to your form. Then, assign the manager control to ChartManager property of all LightningChartUltimate controls.
15.1 Chart interoperation, drag-drop
ChartManager control can be used to coordinate interoperation of several LightningChartUltimate controls. It enables series drag-drop from chart to another, in WinForms. For WPF it’s not usable for technical reasons.
Series have DisableDragToAnotherAxis property, and it must be set to False to enable the dragging. It is True by default.
Axes have AllowSeriesDragDrop property which can be set to False to prevent dragging over specific axis. Default is True.
Move mouse over the series to be dragged, press left mouse button down to start dragging.
Dragging over Y axis: Drag the series over Y axis of other chart and release the button. The other chart takes the ownership of the series and the series is assigned to the target Y axis. It also assigns the first X axis for the series.
Dragging over X axis: Drag the series over X axis of other chart and release the button. The other chart takes the ownership of the series and the series is assigned to the target X axis. It also assigns the first Y axis for the series.
15.2 Memory management enhancement
In some extreme real-time monitoring applications the .NET garbage collector does not free unused memory nicely enough, if the application is run with high CPU load. Garbage collector frees the memory all at once, causing a visible ‘freeze’ or ‘pause’ in chart updating. To make the chart updates smoother, enable ChartManager’s MemoryGarbageCollecting property. By doing that, a separate thread is used to free the memory more often regardless of the CPU load. Using MemoryGarbageCollecting is recommended to be used with multi-core processors, as the thread running will slightly load the CPU.
16. SignalGenerator component
SignalGenerator component can be used to generate real-time signal. The signal is produced as sum of different waveforms. Several SignalGenerator components can be connected together with master-slave relationship, to produce a synchronized, multi-channel output. SignalGenerator is very useful when developing signal monitoring or data acquisition software with LightningChart.
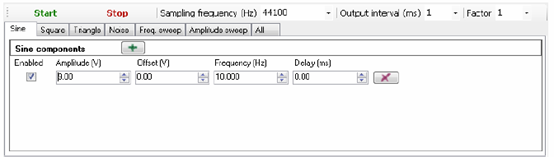
Figure 16-1. Signal generator component with Sine page selected.
The waveforms are divided into following categories: Sine, Square, Triangle, Noise, Frequency sweep, and Amplitude sweep. You notice the tab pages for them in the component. In Sine page, you can add the sine waveforms. In Square page, you can add the square waveforms. In Triangle page, you can add the triangle waveforms. In Noise page, you can add random noise waveforms. In Frequency sweep page, you can add frequency sweeps. In Amplitude sweep page, you can add amplitude sweeps. In All page, you can set all waveforms in stacked view.
16.1 Sampling frequency, Output interval and Factor
Sampling frequency tells how many signal points are generated per second. Higher sampling frequency produces more accurate signal, but with cost of increased dataflow and overhead. With high sampling frequency, you can present signals containing high frequencies. Sampling frequency must be more than twice the maximum signal frequency, to fulfill Nyquist sampling theorem.
Output interval sets the preferred interval of calculated output samples, in milliseconds. For example, if you set here 100, you will get a bundle of samples 10 times per second, after every 100 ms period. Using lower values here will give smoother real-time monitoring output. Note that output interval is not accurate, and may vary with computer load. The output data stream automatically gives more samples out if the period has been longer than expected, and the data stream will get in shape also with high data rates and under heavy computer overhead.
Factor multiplies the output samples with selected value. For example, to generate mV signal instead of
V signal, set Factor to 1E-3.
16.2 Sine waveforms
Sine waveform is constructed with Amplitude, Offset, Frequency and Delay parameters. Amplitude is the maximum voltage difference from zero level. Note that the total range is bipolar. Peak-to-peak value will be 2 * Amplitude. Offset is DC level added to the signal, positive values shift the signal up and negative values shift it down in the value range. Frequency tells the signal cycle count in Hertz. One cycle per second is frequency of 1 Hertz. Delay delays in the signal in milliseconds.
A simple sine waveform with the following settings
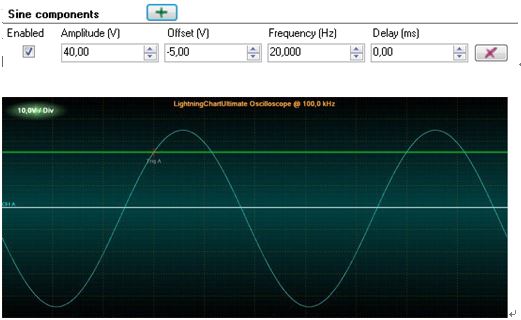
Figure 16-2. One sine waveform signal.
Respectively, two sine waveforms with the following settings
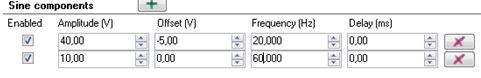
produces signal like the following figure.
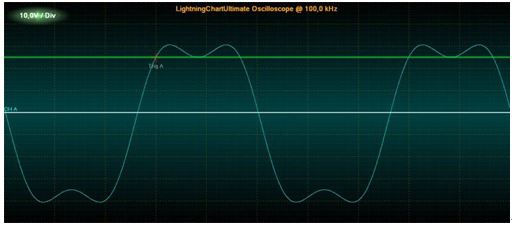
Figure 16-3. Two sine waveforms signal.
16.3 Square waveforms
Square waveform has one more parameter, Symmetry. The range for symmetry is 0…1. Symmetry tells how long the signal is in high state, related to cycle period. With Symmetry of 0.5 the low and high states of the signal are of equal lengths.
Square waveform with the following settings
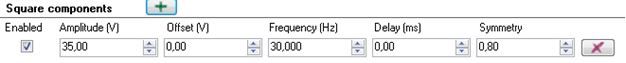
produces a signal like the following.
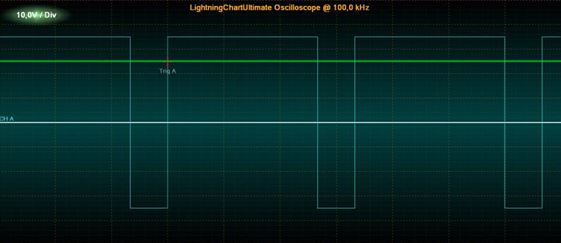
Figure 16-4. One square waveform signal, with symmetry of 0.8.
16.4 Triangle waveforms
Triangle waveform has also Symmetry parameter. It controls side and amount the triangle leans. 0.5 is the value for symmetrical triangle. Values under 0.5 lean left and values over it lean right.
Triangle waveform with the following settings
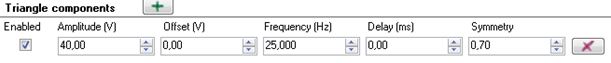
produces a signal like the following

Figure 16-5. One triangle waveform signal, with symmetry of 0.7.
16.5 Noise waveforms
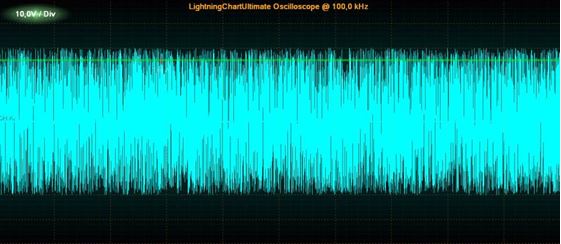
Noise waveform is a randomly generated signal. Points get randomized between –Amplitude and+Amplitude.
Noise waveform with the following settings
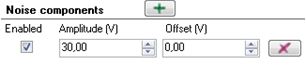
produces a signal like the following

© Copyright 2000-2025 COGITO SOFTWARE CO.,LTD. All rights reserved
