8. ViewPolar
ViewPolar allows data visualization in a polar format. The data point position is determined by angular value and amplitude (compare angle as X and amplitude Y in ViewXY). Polar view has zooming and panning features.
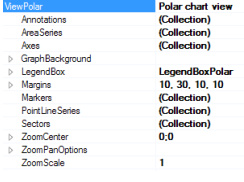
Figure 8-1. ViewPolar object tree.
8.1 Axes
You can define polar axes into Axes list property. Several axes can be used in same chart. Series can be assigned with any of these axes by setting AssignPolarAxisIndex property of a series. An axis represents both angular scale and amplitude scale. Otherwise, the polar axes are very similar to ViewXY axes, see section 5.2.
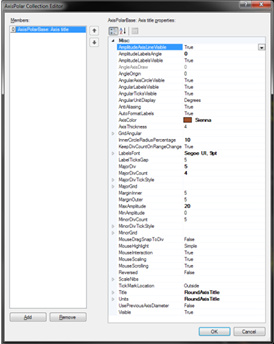
Figure 8-2. AxisPolar property tree
Figure 8-3. Three axes, first (red) in the oute

r circle, second (green) in the middle, and third (blue) closest to center. Axis AngleOrigin can be changed by dragging it over the axis circle. Amplitude range can be changed by dragging from the axis. Minimum or maximum of axis amplitude range can be changed by dragging from the small nib in the end of the amplitude scale.
8.1.1 Reversed axes
The axis can be reversed by amplitude, angle or both.
To reverse the angle scale, set AngularReversed = True. To reverse the amplitude scale, set
AmplitudeReversed = True.
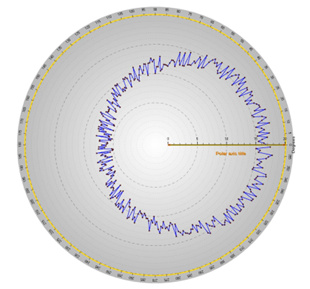
Figure 8-4. On the left, scales are not reversed. On the right, AngularReversed = True and AmplitudeReversed = True.
8.1.2 Setting rotation angles of the scales
Use AngleOrigin to set the rotation angle of angle scale.
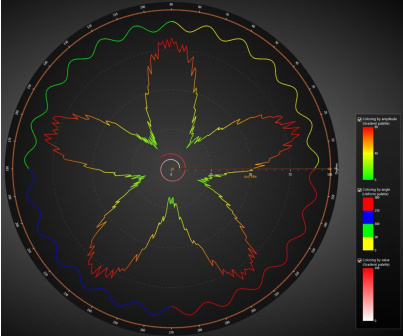
Figure 8-5. AngleOrigin = 30.
Use AmplitudeAxisAngle to rotate amplitude axis position. Amplitude scale angle can be set as absolute angle (AmpitudeAxisAngleType = Absolute), or relative to angle scale’s angle.
(AmpitudeAxisAngleType = Relative).
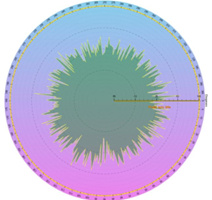
Figure 8-6. AngleOrigin = 30. AmplitudeAxisAngle = 90. On the left, AmplitudeAxisAngleType = Absolute. On the right, AmplitudeAxisAngleType = Relative: Overall the amplitude scale rotates 120 degrees in this case.
8.1.3 Setting divisions
Set the amplitude division count with MajorDivCount, and division magnitude with MajorDiv property. The amplitude scale will adjust accordingly (updating MaxAmplitude). Set amplitude minor division count with MinorDivCount.
By default, the chart tries to include almost as many angular divisions as it can fit. To control the angular divisions, set AngularAxisAutoDivSpacing to False. Then the chart tries AngularAxisMajorDivCount count of divisions. If chart space is too small to render all the divisions and labels, it will use a lower division count that it can fit.
8.2 PointLineSeries
PolarView’s PointLineSeries can be used to draw a line, group of points or point-line. Lots of line and point styles are available in LineStyle and PointStyle properties.

Figure 8-7. Some data presented with ViewPolar’s PointLineSeries. Line and points are both visible.
8.2.1 Setting data
This code represents the data setting of previous figure.
int iCount = 360;
PolarSeriesPoint[] points = new PolarSeriesPoint[iCount];
Random rnd = new Random();
for (int i = 0; i < iCount; i++)
{
points[i].Amplitude = 10.0 + 3.0 * rnd.NextDouble() + 5.0 * Math.Cos(AxisPolar.DegreesAsRadians((double)i * 1.0));
points[i].Angle = (double)i;
}
chart.ViewPolar.PointLineSeries[0].Points = points;
8.2.2 Palette coloring
Line coloring supports palette.
Use ColorStyle property to select how the palette coloring is applied
• LineStyle: No palette fill. The color set in LineStyle.Color property applies
• PalettedByAngle: Data point Angle field determines the color
• PalettedByAmplitude: Data point Amplitude field determines the color
• PalettedByValue: Data point Value field determines the color
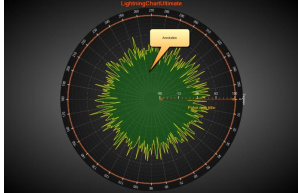
Figure 8-8. Palette coloring applied.
Use ValueRangePalette property to define the colors and value steps, it works in similar way than with
ViewXYs' and View3D's series.
8.2.3 Custom shaping and coloring with CustomLinePointColoringAndShaping event
Custom coloring and coordinate adjustment can be made with CustomLinePointColoringAndShaping event, which is called just before entering the rendering stage of the chart. It works in similar way than the CustomLinePointColoringAndShaping event in ViewXY’s FreeformPointLineSeries, see 5.8.2.
8.3 AreaSeries
Area series allow data visualization in filled area style. The line style in the edge can be edited with
LineStyle property. Fill can be changed with FillColor property.

Figure 8-9. Some data presented with ViewPolar’s AreaSeries.
8.3.1 Setting data
This code represents the data setting of previous figure.
int iCount = 360;
PolarSeriesPoint[] points = new PolarSeriesPoint[iCount];
Random rnd = new Random();
for (int i = 0; i < iCount; i++)
{
points [i].Amplitude = 30f + rnd.NextDouble() * 5f * Math.Sin((double)i / 50f);
points [i].Angle = (double)i;
}
chart.ViewPolar.AreaSeries[0].Points = points;
8.4 Sectors
Sectors can be defined to indicate some angular or amplitude range. Define amplitude range with MinAmplitude and MaxAmplitude properties. Define angular range with BeginAngle and EndAngle. You can move a sector by dragging it with mouse.

Figure 8-10. A couple of examples sectors are used in. In the first figure, there’s a PointLineSeries and sector. In the second figure, a dial is made with AreaSeries and a sector represents RPM meter red zone.
8.5 Annotations
Annotations are almost similar to ViewXY’s Annotations, see section 5.19, but Target is Location are defined in Polar axis values. Sizing by axis values is not suitable and therefore Sizing property has only values Automatic and ScreenCoordinates.
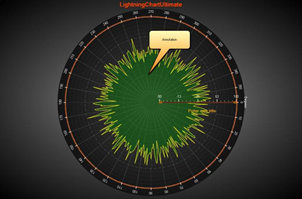
Figure 8-11. An annotation in Polar view.
8.6 Markers
Markers can be used a specific data value at certain position. Assign the marker with a preferred axis by setting its AssignPolarAxisIndex. Define Amplitude and AngleValue properties to put it into place. Edit Symbol to have the appearance you prefer, and define text with Label property.
Markers can be moved by dragging it with mouse. Set SnapToClosestPoint to Selected or All to enable nearest data point snapping when dragging it. Selected tracks only the series this marker is set to snap to with SetSnapSeries() method. All tracks all series.
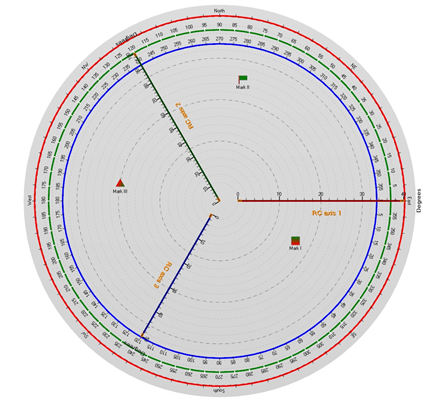
Figure 8-12. A couple of markers in a polar chart.
8.7 Zooming and panning
Zooming can be applied by code, by setting ZoomCenter and ZoomScale properties. ZoomCenter is defined as relative X-Y ranges.
X = -1: polar view's left edge at center of chart area
X = 0: polar view's center at center of chart area
X = 1: polar view's right edge at center of chart area
Y = -1: polar view's bottom edge at center of chart area
Y = 0: polar view's center at center of chart area
Y = 1: polar view's top edge at center of chart area
ZoomScale is the magnifying factor. E.g. 2 makes the chart appear twice as large in both X and Y
direction than with 1.
Mouse-zooming features can be configured in ZoomPanOptions property tree.
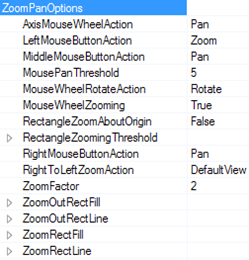
Figure 8-13. ViewPolar's ZoomPanOptions.

© Copyright 2000-2025 COGITO SOFTWARE CO.,LTD. All rights reserved
