
Key Features
How can I make sure I’m the first to know about end-user issues?
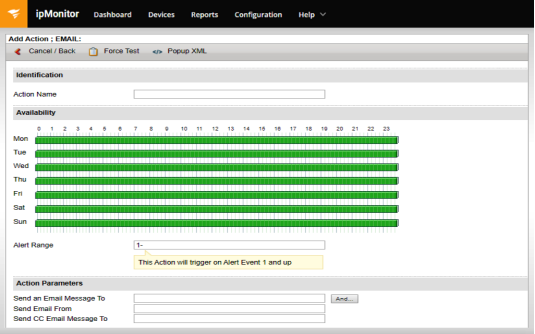
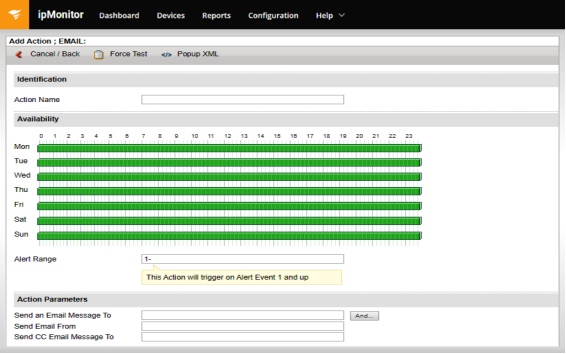
SolarWinds® ipMonitor® IT monitoring tool offers over a dozen notification types to help ensure you know about network issues or application failures. Receive alerts via email, text message, or right to Windows Event Log files. Be the first to know about network issues and application failures and escalate alerts to other IT staff.
How can I minimize downtime?
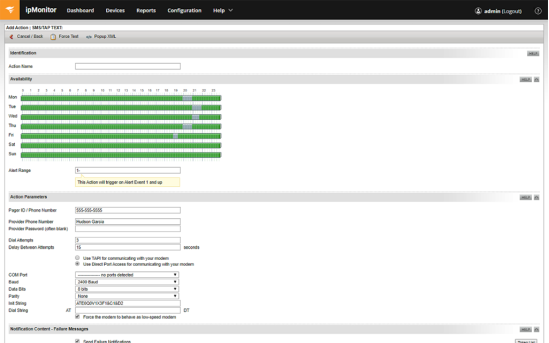
Take advantage of automating remediation actions to reduce downtime with ipMonitor. Restart failed applications and Windows services, reboot servers, back up files, and run scripts. Avoid late night calls and resolve issues without your intervention by automating corrective actions to restore services if a failure occurs.
How long does it take to start monitoring with ipMonitor?
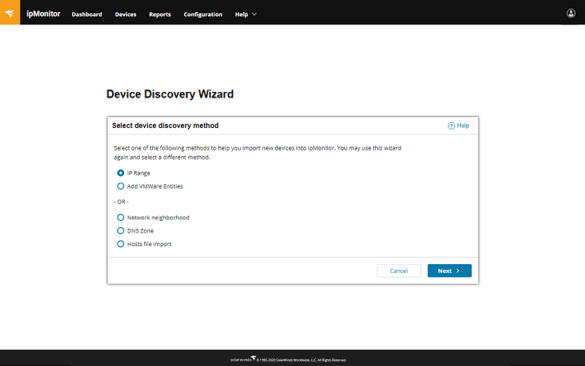
You can start monitoring typically in minutes. ipMonitor is a lightweight network monitor software running on one machine with minimal system requirements. Flat file storage means no separate database to maintain. Our Startup Wizard guides you through an automated discovery and alert configuration process, offering out-of-the-box recommendations for what to monitor on each device and application. Discover critical IT devices typically in a few minutes and monitor their availability, responsiveness, and performance from one console.
How can I easily monitor my most essential network services?
Monitor common ports with key protocols such as SNMP for rapid detection of performance issues. Monitoring your common ports can allow you to more easily keep track of activity within your network and within devices using communication data from your network services.
How can I pinpoint performance issues of my network devices, servers, VMware hosts or applications?
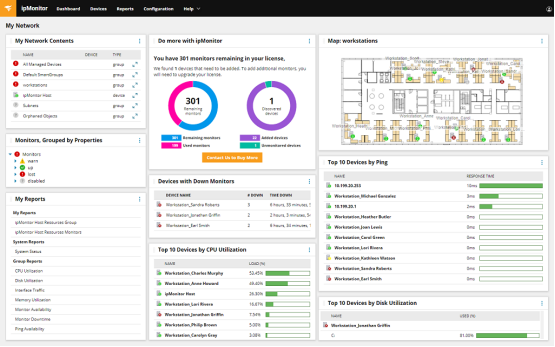
Take advantage the network maps and NOC view in ipMonitor to quickly see what devices, servers (including virtual), or applications are experiencing availability or performance issues. Drill down to get specific metrics associated with the problem.
How can I improve my IT reporting?
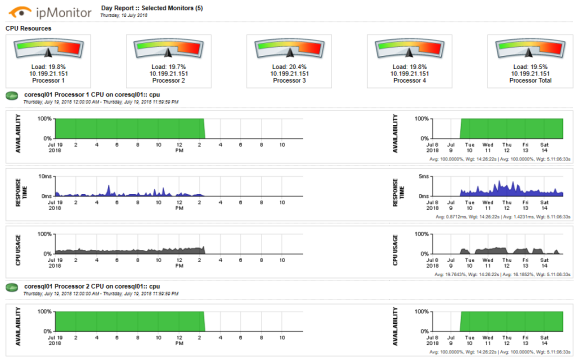
Enhance IT monitoring with built-in reports and dashboards—monitor historical performance data on customizable reports and schedule delivery via email. Point-and-shoot zoomable reports give you the ability to view data for a specific time period or event—particularly useful to identify the root cause of failures.
© Copyright 2000-2025 COGITO SOFTWARE CO.,LTD. All rights reserved