SQL Aggregate Functions are functions that perform calculations and return a summarized result. With these, it’s easy to do these calculations on data sets:
Count,
Sum,
Average,
or getting the minimum or maximum values.
But there’s more.

Statistical calculations like standard deviation and variance are also part of the tools. Mix it with grouping and sorting, and you’ll have something fantastic for your new report.
So, how easy can it be?
Today, punch up your skills to write SQL queries with SQL aggregate functions supported by SQL Server. Get to know each of them and when you can use them. And, of course, we’ll get practical examples.
Let’s start.
SQL COUNT Function
SQL COUNT is what the function name implies. It counts.
When to Use It
For anything that you wish to count in your data. It can be the number of employees, products sold, or days elapsed. You name it.
Practical Examples of COUNT Function in SQL
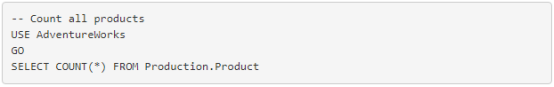
COUNT RECORDS IN A TABLE
The first and easiest way to learn COUNT is to count all records in a table. This includes NULLs and duplicates.
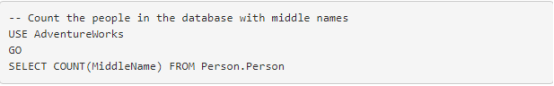
COUNT NON-NULL VALUES
It can also be expressed with the ALL keyword.
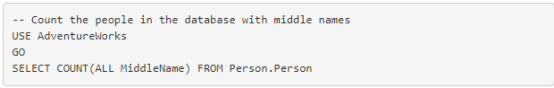
If you take away the ALL keyword, SQL Server assumes you mean ALL. This is the default setting.
COUNT UNIQUE VALUES
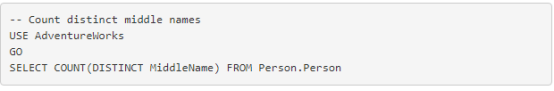
If there are 2 or more Smith or Cruz middle names, it will be counted as one.
COUNT WITH PARTITION OR GROUPING
All previous COUNT examples return 1 row. Now, let’s try to partition the results.
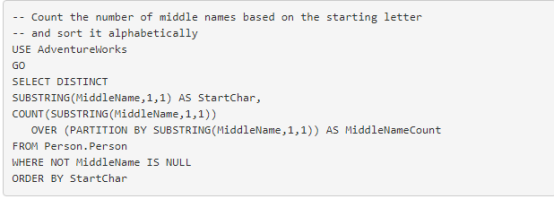
This counts all middle names that start with A, B, C, and so on. You can see the results in Figure 1 below.

Figure 1. Result set of COUNT with OVER…PARTITION BY.
There’s another way to write this that will return the same results.
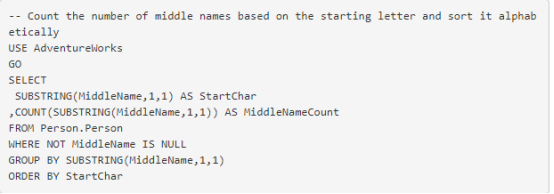
Using GROUP BY to produce this query is faster than using the OVER clause. How do we know this? By using the Execution Plan and STATISTICS IO, which is covered here. You can check it out later.
Other SQL Aggregate Functions for Counting
COUNT returns an INT data type. If you need to count big data sets up to 9,223,372,036,854,775,807, then COUNT won’t work. You need COUNT_BIG. It returns a BIGINT data type suited for counting very large data sets. It functions the same as COUNT, but the difference is in the type of data returned.
Is COUNT(DISTINCT expression) too slow for your large data set? Then, use APPROX_COUNT_DISTINCT. It uses less memory footprint than COUNT DISTINCT. It is suitable for large data sets with many distinct values.
However, the speed has a catch.
APPROX_COUNT_DISTINCT returns approximate counts. If you need to count large distinct values where speed is more important than precision, this is it. It guarantees up to a 2% error rate with a 97% probability.
SQL SUM Function
SUM is used to sum numeric values in a data set.
When to Use It
You can use it in calculating monthly total sales and the like.
Practical Examples of SUM Function in SQL
FORMATTED SUM FOR A PERIOD
Below is a sample of using SUM with a condition. The result is formatted with comma separators.

GROUP TOTALS FOR A PERIOD
This example will add the use of JOIN, GROUP BY, and HAVING clauses. Notice that you can use SQL aggregate functions like SUM in the SELECT list and the HAVING clause.
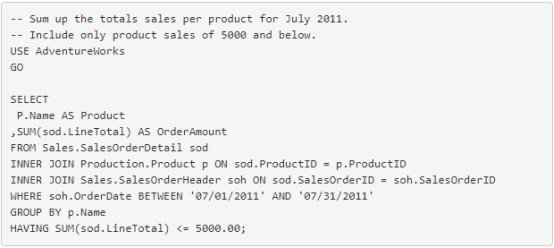

Figure 2. Result set of using SUM with GROUP BY and HAVING clauses.
SQL AVG Function
SQL AVG Function is used to get the average of numeric values in a data set.
When to Use It
You can use it in calculating the average of:
monthly sales,
number of product returns,
daily customer complaints,
etc.
Practical Examples of AVG Function in SQL
USE AVG() WITH A CONDITION
Here is a simple, straightforward example of using AVG.

GROUP AVERAGES WITH A CONDITION MIXED WITH ANOTHER SQL AGGREGATE FUNCTION
In this example, you can mix AVG with SUM. The result is also grouped and sorted.

The figures are formatted with number separators. Check out Figure 3 below.
Figure 3. Sample result set in a query using AVG().
SQL MIN Function
Use MIN to get the lowest value from a set of values. The data to aggregate can be a number, string, or date.
When to Use It
It is good for finding the cheapest product, the current monthly salary, the earliest flight, and more.
Practical Examples of MIN Function in SQL
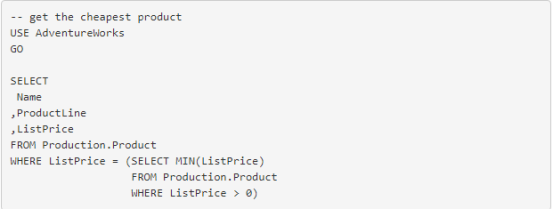
USING MIN WITH A SUBQUERY
USING MIN WITH GROUP BY AND ORDER BY
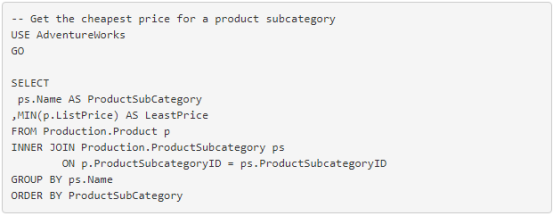
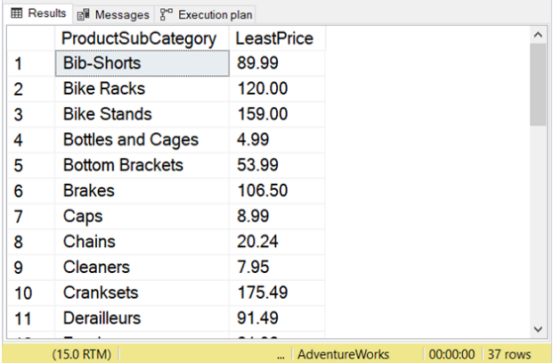
Figure 4. Result set of a query using MIN to get the least price per product subcategory.
SQL MAX Function
Use MAX to get the largest or the last value in a set of values. Like MIN, you can use this to aggregate numbers, strings, and dates.
When to Use It
This is good for getting the highest-grossing film of all time, the most number of votes, the highest-paid guy, and more.
Practical Examples of SQL MAX Function
USING MAX WITH OTHER SQL AGGREGATE FUNCTIONS
You can use MAX with MIN Functions in SQL Server and COUNT in one query. Check out the example below.
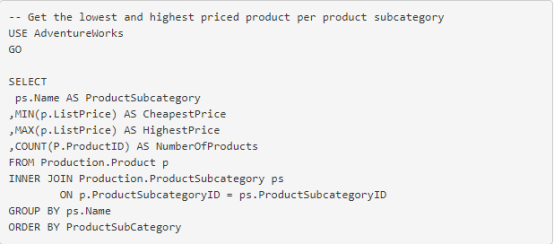
Check a better view of product pricing per subcategory in Figure 5 below.
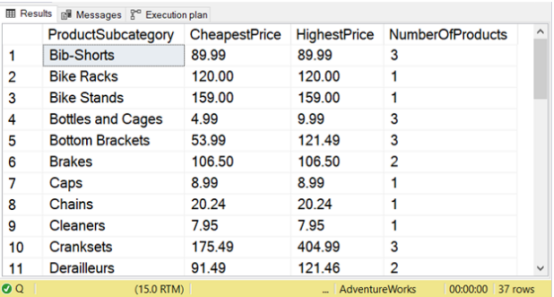
Figure 5. Result set showing the lowest and highest price of a product per subcategory.
USING MAX WITH DATES
Aside from numbers, you can also use MAX with dates like the example below.
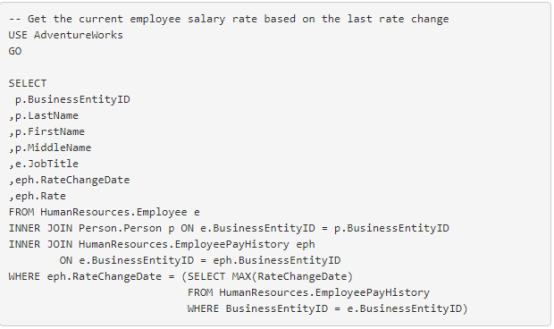
The sample above gets the latest salary rate through the last rate change of an employee in the EmployeePayHistory table. Check out the results in Figure 6 below.

Figure 6. The sample result set of a query using MAX function on dates.
VAR and VARP Functions in SQL
Use SQL VAR() to get the statistical variance of a representative or sample in a given numeric data set. Meanwhile, VARP() is for the entire population of a numeric data set, hence we have P after VAR.
When to Use It
Getting the variance is less common compared to SUM or AVG. But in business, you can use this in the following scenarios:
to know if stocks are volatile or stable,
if the time it takes to deliver a product is getting worse,
if the time it takes a customer to fill up a webform is better than before,
etc.
The result of the variance tends to be exaggerated. So, the popular choice for measuring variability is the standard deviation. More on the standard deviation later.
Practical Example of VAR and VARP Functions in SQL
For this item, we only have 1 example, but it needs a bit of explaining to make it practical.
DATA PREPARATION
Let’s prepare the data first. We will use it for variance and standard deviation examples later.
CREATE TABLE ServiceProviderTransactions
(
TransactionID INT NOT NULL IDENTITY(1,1) PRIMARY KEY,
ServiceProviderID INT,
ServiceID TINYINT,
ClientID INT,
TransactionDate DATETIME,
DatePaid DATETIME,
ServiceAmount DECIMAL(6,2)
)
GO
INSERT INTO ServiceProviderTransactions
(ServiceProviderID, ServiceID, ClientID, TransactionDate, DatePaid, ServiceAmount)
VALUES
(1,1,1,'05/29/2020 00:00','06/05/2020 16:47',350.00),
(1,1,1,'06/12/2020 00:00','06/24/2020 19:22',350.00),
(1,1,1,'06/24/2020 00:00','07/02/2020 18:20',350.00),
(1,1,1,'07/14/2020 00:00','07/14/2020 22:44',350.00),
(1,1,1,'07/31/2020 00:00','08/06/2020 21:53',350.00),
(1,1,1,'08/17/2020 00:00','09/02/2020 23:11',350.00),
(1,1,1,'09/14/2020 00:00','09/14/2020 22:51',350.00),
(1,1,1,'10/02/2020 00:00','10/09/2020 23:11',350.00),
(1,1,1,'10/15/2020 00:00','10/21/2020 23:13',350.00),
(1,1,1,'10/23/2020 00:00','10/29/2020 23:58',350.00),
(1,1,1,'10/30/2020 00:00','11/09/2020 23:44',350.00),
(1,1,1,'11/06/2020 00:00','11/11/2020 15:58',350.00),
(1,1,1,'11/11/2020 00:00','11/11/2020 15:58',350.00),
(1,1,1,'11/20/2020 00:00','11/27/2020 18:13',350.00),
(1,1,1,'12/04/2020 00:00','12/15/2020 01:52',350.00),
(1,1,1,'12/11/2020 00:00','12/23/2020 01:39',350.00),
(1,1,1,'12/18/2020 00:00','12/23/2020 20:30',350.00),
(1,1,1,'01/22/2021 12:43','01/28/2021 01:02',350.00),
(1,1,1,'02/04/2021 22:23','02/09/2021 17:33',350.00),
(1,1,1,'02/05/2021 15:48','02/13/2021 00:02',350.00),
(1,1,1,'02/12/2021 13:21','02/17/2021 08:03',350.00),
(1,1,1,'02/19/2021 22:58','02/24/2021 01:27',350.00),
(1,1,1,'02/26/2021 18:26','03/09/2021 20:23',350.00),
(1,1,1,'02/26/2021 18:44','03/09/2021 20:23',350.00),
(1,1,1,'03/05/2021 13:53','03/22/2021 20:27',350.00),
(1,1,1,'03/12/2021 13:41','03/22/2021 20:27',350.00),
(1,1,1,'03/19/2021 17:32','03/24/2021 19:49',350.00),
(1,1,1,'03/26/2021 14:29','04/01/2021 18:46',350.00),
(1,1,1,'03/31/2021 19:35','04/01/2021 21:54',350.00),
(1,1,1,'04/16/2021 21:23','04/19/2021 19:44',350.00),
(1,1,1,'04/23/2021 19:04','04/27/2021 20:43',350.00),
(1,1,1,'04/30/2021 20:00','05/11/2021 21:20',350.00),
(1,1,1,'05/07/2021 21:12','05/11/2021 21:20',350.00),
(1,1,1,'05/14/2021 14:56','05/18/2021 09:38',350.00),
(1,1,1,'05/21/2021 10:12','06/01/2021 16:52',350.00)
GO
A BRIEF BACKGROUND OF THE PROBLEM
Before we get to the coding part, we ask some questions related to this data.
Your clients pay you for a living, but how long does it take them to pay you? And when you’re asked a question like this, do you answer, “It takes an average of 10.3542 days before I get paid”? Of course not! The usual answer is, “Sometimes I get paid on the same day. But on other days, it takes 60 days. It sucks when that happens!”
Do you feel the same when a similar situation happens to you?
This proves that we don’t feel the average. This is also true on other matters like product deliveries. You want the MIN amount of time whenever there’s a transaction. But you hate the MAX. There’s a degree of disappointment when deliveries or payments take longer.
And the degree of disappointment can be measured using a statistical variance. The variance rises when it takes longer.
Are you with me now? Then, let’s start coding.
THE SAMPLE SQL CODE WITH VAR AND VARP
We will examine the variance of the number of days it takes Client 1 to pay Service Provider 1 every month. Here’s the code.

We used several SQL aggregate functions aside from VAR and VARP. Figure 7 below will help us understand the results.

Figure 7. Result set of a query to calculate the variance.
ANALYSIS
Within the context of how long it takes for Client1 to pay for the services, note these 4 things from the result. The items of note are numbered in Figure 7.
The variance of 0 or null in the data is straightforward. Only 1 transaction exists. So, no variation exists either.
Both February and March 2021 have an average of 7 days. But notice how far their variances are for both sample and population variances. That’s why average days don’t feel right.
March 2021 has the highest variance. The higher the variance gets, the more we say, “It sucks!” Of course, this depends on how long you can tolerate non-payment. Can you imagine if the maximum takes 90 to 120 days?
If you compare #3 to #4, you will see why March 2021 has the highest variance. The data is highly dispersed between 1 and 17.
You may ask, why use both sample and population variances? What’s the point?
In our case, the point is to show an example. But in the real world, you must choose one. Our data contains 1 client and 1 service provider. It looks like it’s a subset of a large data set. If that is the case, sample variance makes sense. If we are only interested in Client 1 and Service Provider 1, that subset is the only information we need. So, that makes the population variance applicable. Yet, if this is the only data there, then population variance makes more sense.
But when you say the variance is 29.36, what’s the unit involved? Besides, the longest period to wait for payment is only 17 days. That’s one thing why variance is confusing and standard deviation makes more sense.
STDEV SQL and STDEVP Functions in SQL
STDEV() returns the statistical standard deviation for a representative or sample in a numeric data set. Meanwhile, STDEVP() is used if the data is from a complete or whole population.
Unlike the variance, standard deviation deals with units used in the calculation of mean or average. These units can be days, hours, dollars, points, meters, or whatever unit of measure is required.
Standard deviation is the square root of the variance. It also tells how far a value is from the average.
When to Use It
Like the variance, the standard deviation is a measure of variability. So, the usual use cases will work. There are other cases when variance makes more sense, though, but they are out of the scope of this article.
Here are some more use cases:
Interpreting data from opinion polls.
Study risk markers of heart disease for males 45 to 65 years old
Know the variation of ages in a national survey.
Practical Example of STDEV SQL and STDEVP SQL Functions
Our example for the standard deviation will just expand the earlier example with variance. This way, we can compare the 2 with data.

Figure 8 below shows the results.

Figure 8. Result set with both standard deviation and variance.
Since the standard deviation is the square root of the variance, the result is a smaller value. Yet this is closer to our minimum, maximum, and average figures. The standard deviation for March 2021 (boxed in Figure 8) is also the highest. The rest tells the same story as the variance.
STRING_AGG SQL Function
STRING_AGG() concatenates strings from rows with a separator between each. The separator is not added at the end of the last string.
When to Use It
Producing a text for data integration and the like.
Practical Example of SRTING_AGG SQL Function
Our example is to form a pipe-delimited text data based on name, birthdate, and job title.

Check out the result in Figure 9 below. It uses the Data Viewer in SQL Server Management Studio.

Figure 9. Result of using STRING_AGG to produce pipe-delimited text data.
CHECKSUM_AGG SQL Function
CHECKSUM_AGG returns the checksum of the values in a data set.
When to Use It
You can use this to compare if 2 tables are the same.
Practical Example of CHECKSUM_AGG Function in SQL
To use this to compare data from 2 tables, let’s create a temporary copy of the Products table from the AdventureWorks database. Then we get the checksum of the original and the copy.
Aside from CHECKSUM_AGG(), we will also use BINARY_CHECKSUM to get the checksum of a row.
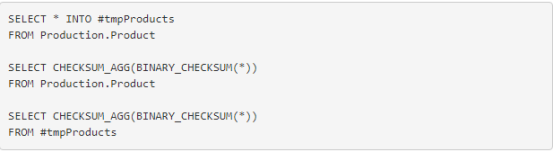
Here’s the checksum of the 2 before any changes:
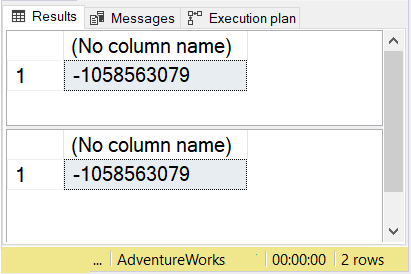
Figure 10. Checksum of the original and the copy of the Products table. The checksums are the same.
Now let’s delete some records from the temporary table. Then, we get the checksum again.
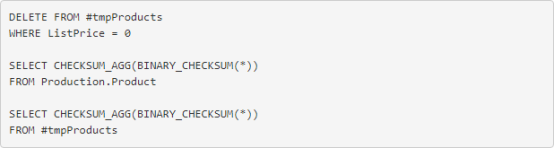
See the changes in the checksum after the deletion of records in Figure 11.

Figure 11. Result of CHECKSUM_AGG after deleting records from the Products table duplicate.
Note, however, that there’s little chance that the calculated checksum will not change.
GROUPING and GROUPING_ID Functions in SQL
GROUPING returns 1 if the indicated expression used in the GROUP BY clause is aggregated. Otherwise, it returns 0.
Meanwhile, GROUPING_ID computes the level of grouping.
Both functions require the use of GROUP BY. Both will return zero if there are no ROLLUP, CUBE, or GROUPING SETS in the GROUP BY clause. So, the results will make sense if any of those keywords are present in the GROUP BY clause.
When to Use It
When your SELECT statement has a GROUP BY clause, and you need subtotals and totals within the results.
Practical Example of GROUPING and GROUPING_ID Functions in SQL
To understand how this works, let’s have a query that doesn’t have these SQL GROUPING and GROUPING_ID functions.
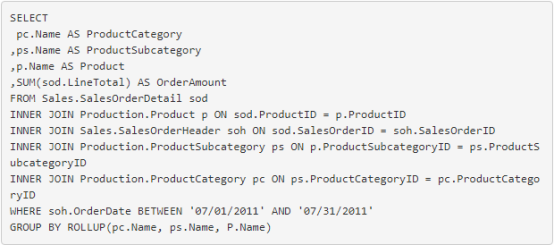
That’s it. We have the GROUP BY ROLLUP in the statement. Now, let’s inspect the results in Figure 12 below.

Figure 12. Result of a query using GROUP BY ROLLUP without GROUPING and GROUPING_ID.
What are those nulls in Figure 12?
Without the ROLLUP, those will not appear. They are totals and subtotals. The boxed portions in Figure 12 are indicators. These are for the subtotal of Helmets subcategory and the total for Accessories category. Not so presentable, isn’t it? GROUPING and GROUPING_ID will allow you to format these totals and subtotals.
Let’s use them in the code below.

I added the output of GROUPING and GROUPING_ID in the query. These outputs are useful for the CASE WHEN clauses in code. Let’s see the output in Figure 13.
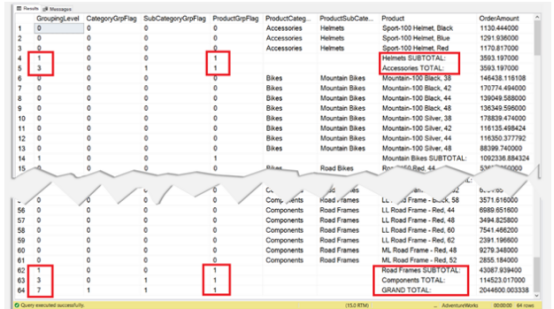
Figure 13. Result set of a query using GROUP BY ROLLUP with GROUPING and GROUPING_ID.
Notice the boxed portions in Figure 13? We used the indicated grouping levels and group flag in the code earlier. And those levels and flags were used to format the output, remove the nulls, and add a better caption.
This is much better.
The Bottom-line in Using SQL Aggregate Functions
So, how’s your tour of SQL aggregate functions?
These functions shine on summarized calculations in reports. Though some of them have other purposes as well. You can also categorize the output with GROUP BY and OVER PARTITION BY. Then sort using ORDER BY.
Modern SQL tools make all tasks related to the aggregate functions more straightforward. In particular, the Devart SQL Complete plugin for SSMS calculates the MIN, MAX, AVG, SUM, COUNT, and DISTINCT results automatically. You only need to select the cells in the SSMS results grid to view the accurate results.
I hope the discussion of each of the functions and their practical examples proved helpful to you.
Like this? Then please share it on your favorite social media platforms.

Edwin Sanchez
Software developer and project manager with a total of 20+ years of software development. His most recent technology preferences include C#, SQL Server BI Stack, Power BI, and Sharepoint. Edwin combines his technical knowledge with his most recent content writing skills to help new breed of technology enthusiasts.

© Copyright 2000-2025 COGITO SOFTWARE CO.,LTD. All rights reserved
