Windographer
Import, analyze and visualize wind resource data quicker and easier than ever before with Windographer
Windographer software is designed for importing, analyzing and visualizing wind resource data measured by met tower, sodar or lidar. This software is unique because it has the ability to quickly import data from a variety of different formats allowing for rapid quality control and statistical analyses, including measure-correlate-predict (MCP), and the functionality to export data to almost any wind flow model that is commonly used within the wind power industry.
Speed matters – Windographer quickly imports data from almost any format and automatically determines the data structure.
Import all kinds of data – Windographer reads virtually all data formats common to the wind power industry.
Intelligent data import – Windographer automatically identifies which columns contain wind speed, standard deviation, vertical wind speed, direction, temperature, pressure, and relative humidity data.
Combine multiple data files – The File > Append process adds data from one or more data files to an existing data set.
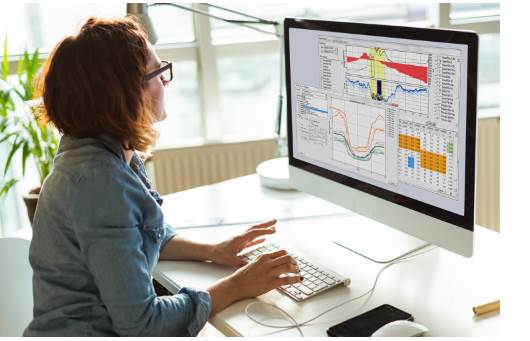
Dashboard-style summary – See the key information at a glance: vertical wind shear profile, wind frequency rose, seasonal and diurnal profiles, mean temperature, wind power density, wind shear coefficients and more.
Scrollable time series graphs – A unique time series graph allows you to zoom in and out, scroll forwards or backwards in time, show or hide data columns, and compare side-by-side all with single clicks.
Wind roses – Create many types of wind roses, including frequency by direction, mean value of any data column by direction, total wind energy by direction, and even polar scatterplots.
Frequency histograms – Plot frequency histograms for any data column. For wind speed data columns, Windographer overlays the best-fit Weibull distribution.
Explore the latest version of Windographer
The latest version of Windographer includes the following features as well as core features:
Data Management
Quality Control
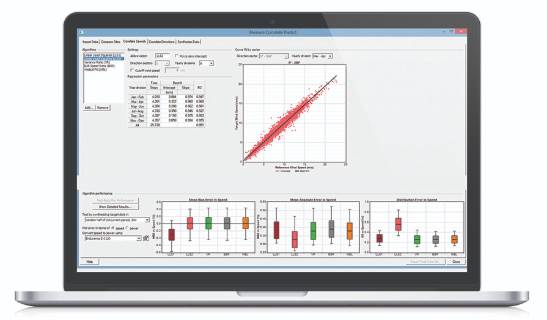
Measure – Correlate – Predict (MCP) Module
Create Professional Output

© Copyright 2000-2026 COGITO SOFTWARE CO.,LTD. All rights reserved
