What's New in Surfer 20
For the Surfer 20 release, we focused on adding functions to automation, optimizing existing tools for batch processing, and we included some exciting new features as well. The top new features are listed below.
Mapping improvements
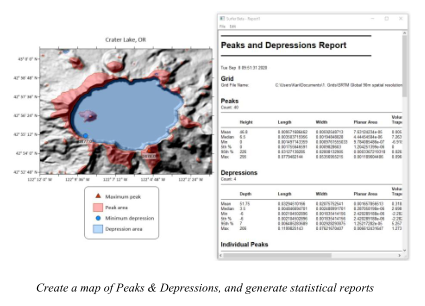
You can now create maps showing peaks and depressions with this new feature in Surfer! Highlight zones in which drainage flows away from (peaks) or into (depressions) closed contours. Useful for those working in water resources and geohazard identification, this new feature allows quick terrain evaluation and the ability to quickly spot sinkholes or other important karst morphology, fracture zones, lineaments and ridgelines. This new layer type is created from a grid file and it identifies the peaks and depressions in the grid by drawing a polygon around these areas. Color peaks and depressions separately, add directional hachures, label the maxima and minima, and work on a local or map-wide scale. Generate statistical reports for your peaks and depressions that calculates area, volume, orientation, and more.
2. Use a field from the Attribute Table for the Object Name
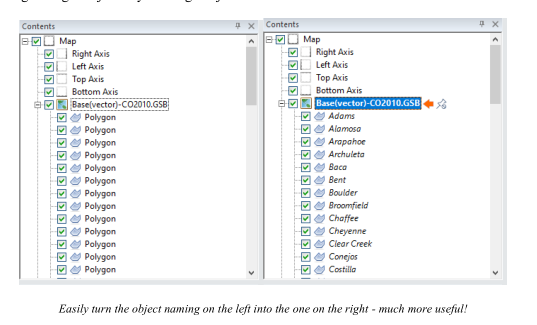
You can now name the vector objects in a Base(vector) layer using an attribute column in the associated Attribute Table. This means that you no longer need to manually rename each object, or have them all default to the names of Polygon, Polyline, Point and so on. Label county boundary polygons with their name or FIPS code, or name your boreholes by their Well-ID.
Finding the right object in your long list just became a whole lot easier.
Workflow improvements
3. Calculate individual grid volumes within a collection of polygons
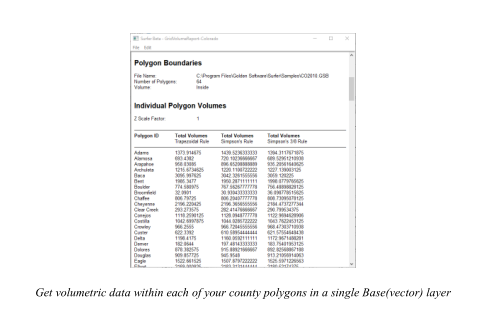
If you have a Base(vector) layer or vector file containing multiple polygons, you can now calculate volumes from a grid within each polygon individually, all in one step. Calculate either the combined volumes for every polygon, or split the report into volumetric data for each individual polygon. Combing this with the new naming objects by attribute feature above, and have each polygon identified clearly by name in the Grid Volume report. This is a big time saver, and no need to use scripting!
4. Calculate individual grid statistics within a collection of polygons
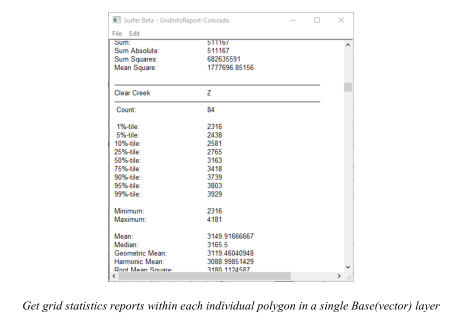
Similar to the new functionality above, statistics generated via Grid Info can now also be calculated for individual polygons in a multi-polygon Base(vector) layer or vector file.
3D View improvements
5. Add Color Scales to the 3D View
It is now possible to display one or more color scales in the 3D View for your points, surfaces and contours. Display a different color scale for each object in the 3D View that uses a colormap.
You can have as many as you need. Export your model with colormaps for use in your next stakeholder report.
6. Export to VRML (.WRL) format
Export your 3D models from the 3D View to VRML format. This 3D Vector model data format is great for working in CAD, and can be manipulated directly in 3D printing software. 3D print some surface models from the VRML format for your next in-person presentation! You can also use this file format in a variety of different 3D modelling software programs such as Cortana, MeshLab, 3DMax, and more.
7. Light point objects using the Environment Lighting
You can now opt to have 3D point objects (cubes and spheres) use the same Environment lighting that applies to your surfaces. Create a consistent source-lit scene that looks great in reports and presentations.
8. Antialiasing
Graphics in the 3D View are now much smoother with the addition of antialiasing. Visual artifacts such as jagged edges, missing parts of lines, and more patterns are now smoothed out for users with modern graphics cards. This smoothing is also maintained during export to image functions and when copying to the clipboard.

Automation improvements
9. New functions available via automation
We've now added a lot of the newer functionality in Surfer to the automation model. The following Surfer processes are now available to automate:
• Create Base from Data map layers via automation
• Use Base Symbology for Base layers via automation
• Use Grid Z Limits when gridding data via automation
• Use a Z Transform when gridding data via automation
• Save and load the Grid Data settings file (*.SRFGDS) via automation
• Set the Map Frame scaling ratio via automation
• Modify the map scale bar options via automation
• Add top-level Legend objects via automation
• Specify and call new Local Coordinate System via automation

© Copyright 2000-2026 COGITO SOFTWARE CO.,LTD. All rights reserved
