PRTG is utilizable as a full-scale syslog server and Simple Network Management Protocol (SNMP) trap receiver without having to install additional software. This section describes a sample configuration for the syslog and SNMP trap receiver and gives you an idea about how to use these features.
Syslog is a well-established standard for computer message logging. Many network devices support sending syslogs to communicate informational, analysis, and debugging messages that are intended for network management and security auditing. SNMP traps are asynchronous notifications from SNMP-enabled devices and can be used to report important incidents and data, just like syslog messages. Devices trigger these messages for various reasons, such as system events, outages, critical conditions, and many more.
PRTG provides two dedicated sensors that work as full-scale syslog and SNMP trap receivers:
Because both the Syslog Receiver and the SNMP Trap Receiver are implemented as common sensors, you do not need to install additional software (for example, you do not need an extra syslog server but only the PRTG web server). You can create the Syslog Receiver sensors as well as the SNMP Trap Receiver sensors in the usual way via the Add Sensor dialog. Then configure your syslog or SNMP trap–enabled devices to send messages to PRTG.
Under lab conditions, PRTG could handle about 10,000 syslog and trap messages per second on a quad core desktop machine when using a single sensor without filters.
The number of messages PRTG can process actually depends on your configuration and system setup. It might be significantly fewer messages.
You can filter the incoming messages by various parameters so that PRTG only processes specific messages and deletes other data right away. Processed messages are stored in an internal, high-performance database on the probe system and are available for review and analysis via the PRTG web interface. The main limiting factor for storing syslog and trap messages is the hard disk space on the probe system.
Sample Configuration
Follow the steps below for a sample configuration of Syslog Receiver and SNMP Trap Receiver sensors. You can apply these instructions to both the SNMP Trap Receiver as well as the Syslog Receiver because the setup works in a similar way for both.
Step 1: Add a Syslog Receiver or SNMP Trap Receiver sensor.
Both sensors inherit an implicit filter from the IP address of the parent device. So it is possible to add these sensors to a probe device. Then you receive all messages from the probe system and can optionally filter for specific sources later. You can also add these sensors directly to the source device. Then only messages from this device are processed.
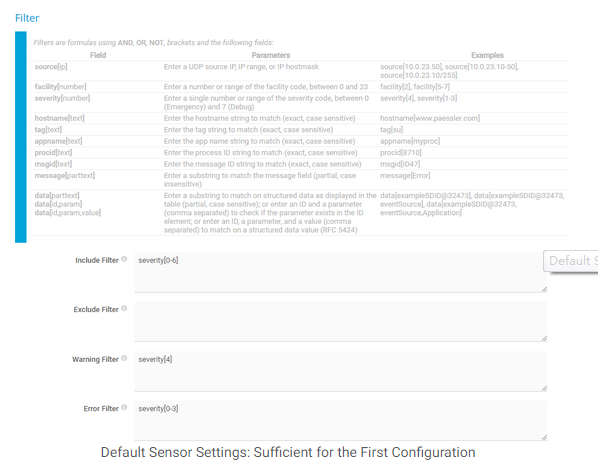
Add the receiver sensors to the desired device in the usual way, for example, via the device's context menu. We recommend that you leave the sensor's default settings unchanged for the first configuration (port, include and exclude filter, warning and error filter) to see what data actually comes in.
Adding the sensor directly to a network device increases its speed in comparison to a filter definition in the sensor settings. Distributing Syslog Receiver and SNMP Trap Receiver sensors over different probes makes the overall performance scalable and gives you flexibility with the data storage location.
If you do not add the sensor to a probe device but to a different device, be careful with the configuration: Ensure that the IP address or Domain Name System (DNS) name of the parent device matches the proper sender. For example, if you want to receive syslog or trap messages from a storage area network (SAN), you might have to add a device using the IP address of a specific array member that sends the messages. Providing a DNS name that points to the IP address of a whole group might not work for SANs.
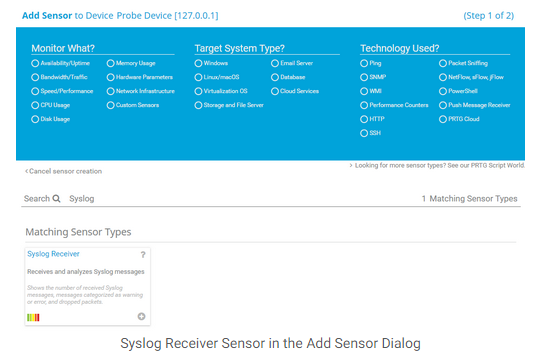
Step 2: Appropriately configure your network devices that support sending syslogs or SNMP traps.
Configure your syslog or SNMP trap ready devices to send syslogs or traps (see the documentation of the respective device vendors). They have to address the probe system where your Syslog Receiver or SNMP Trap Receiver sensor runs. So specify the IP address of the probe system. If you keep your syslog or trap receiver's default settings, use port 514.
The protocol is User Datagram Protocol (UDP).
The SNMP Trap Receiver does not support SNMP v3 traps. Use SNMP v1 or v2c instead.
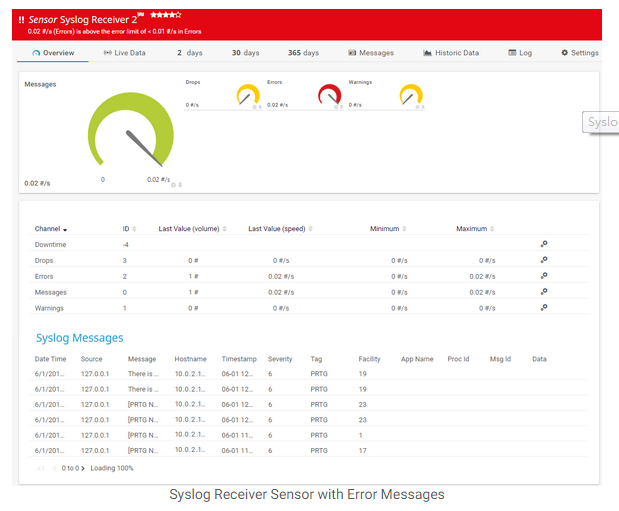
Step 3: Start collecting syslog or SNMP trap messages from your devices.
You do not have to complete any further configuration steps to use PRTG as a syslog server or SNMP trap receiver. When your devices send syslogs or SNMP traps to the specified probe system, the messages appear automatically in the PRTG web interface. After each sensor scan (by default, the scanning interval is inherited from the parent device), PRTG counts the received syslogs or traps in the according channels (total number of messages during the last interval, error and warning messages, or dropped packets).
Let the syslog receiver or the SNMP trap receiver collect data for a while to see what comes in. By default, the respective sensor shows a Warning status if there was at least one message with severity 4 and into an Error status if there was at least one message with severity 3 or lower during the last sensor scan.
Incoming messages are counted per scanning interval, so it might take a few moments to see the received syslogs and traps, depending on the remaining time until the next sensor scan. Of course, you can use Scan Now via the sensor's context buttonsto perform an immediate scan and see corresponding data. The sensor states are also defined per scan.
So, for example, a message that is classified as an error counts for the error channel only for one scanning interval. If there is no new error message in the following scanning interval, no message is shown in the error channel and the Down status disappears after the next sensor scan. The syslog or trap itself is still available on the Messages tab.
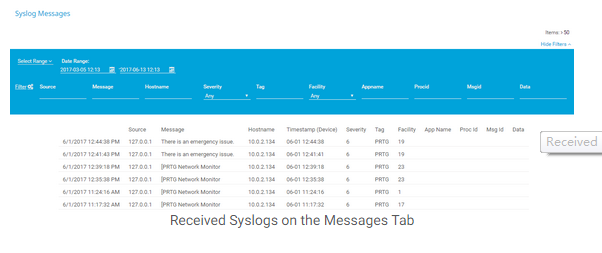
Step 4: Review and analyze the collected data.
All incoming messages that match the include filter are processed and stored in the internal high-performance database of PRTG. Review and analyze the received syslogs and traps via the PRTG web interface. For details, see the respective sections SNMP Trap Receiver sensor and Syslog Receiver sensor. Then you can decide about further filtering of the incoming messages.
The received data is also available in the PRTG data directory as common files. One data file is created per hour.
In PRTG on premises you can add the Management Information Base (MIB) files of your devices to the \MIB subfolder of the PRTG program directory to use them with the SNMP Trap Receiver sensor. This results in object identifier (OID) resolution and makes trap messages more comprehensible. For example, instead of the OID 1.3.6.1.4.1.32446.1.1.2 you would see SNMPv2-SMI-v1::enterprises.32446.1.1.2 = 0 (example from the PRTG MIB file).
Step 5: (Optionally) refine the filters.
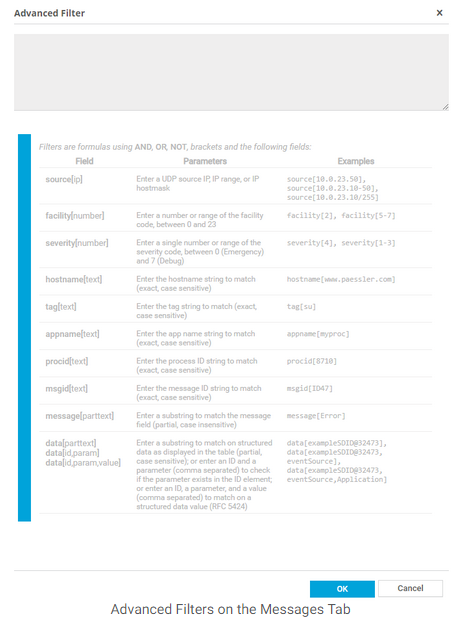
To increase productivity with your PRTG syslog servers and trap receivers, you can adjust the default filter settings. PRTG provides a comprehensible formula system that you can use to describe what kind of messages you want to process and which of them count as error or warning messages. You can configure the following filters for received messages in the settings of the respective receiver:
Use the syntax that is provided in the corresponding sections to define your individual filter rules: SNMP Trap Receiver sensor and Syslog Receiver sensor.
You can create filter rules with a few mouse clicks in the Advanced Filter on the Messages tab of a specific sensor and copy these rules into the sensor settings to apply them.
Step 6: (Optionally) create notification triggers.
By default, the warning and error channels of the Syslog Receiver and SNMP Trap Receiver sensors have a very low upper warning or error limit (0.00000001). The reason for this is that even when only one syslog or trap has been counted in the respective channel during a scanning interval, the overall status of the sensor shows this with the corresponding status. This way, you always recognize if there is something wrong on the monitored system.
Because of this sensor behavior, best practice is to add a state trigger on the Notification Triggers tab of the sensor if you want to get a notification when a warning or error message type comes in. Define 0 seconds Down or Warning time condition to not miss any warnings, errors, or any other messages. Alternatively, you could use a speed trigger for notifications regarding messages per second.
For more information, see the Knowledge Base: How can I configure sensors using speed limits to keep the status for more than one interval?
You can use syslog and trap specific placeholders in notification templates to see the messages when you receive a notification. See the More section for further information.

© Copyright 2000-2025 COGITO SOFTWARE CO.,LTD. All rights reserved