
PRTG Manual: Understanding Basic Concepts
There are a number of basic concepts that are essential for understanding the functionality of PRTG. Setting PRTG up for the first time and getting the first monitoring results happens almost automatically.
Nevertheless, there are some basic principles we would like to explain to you. Read these sections carefully to better understand the underlying architecture of the monitoring system, hierarchy of objects, settings inheritance, and notifications.
PRTG Manual: Architecture and User Interfaces
In this section, we give you an overview of what PRTG is and how it works. If you are new to PRTG or want to learn more, read on for an introduction to PRTG and its components.
Overview
You can classify the components of PRTG into three main categories: system parts, control interfaces, and a basic administration interface.
|
TYPE |
PART OF PRTG |
|---|---|
|
System Parts |
PRTG Core Server Probes We assume that all computers on which the PRTG core server with the local probe or any remote probes run are secure. It is every administrator's responsibility to make sure that only authorized persons can access these machines. For this reason, we highly recommend that you use dedicated machines for your PRTG system parts. |
|
User Interfaces |
PRTG Web Interface PRTG Desktop PRTG Apps for Mobile Network Monitoring |
|
System Administration Program |
PRTG Administration Tool on Core Server System PRTG Administration Tool on Remote Probe System |
PRTG Core Server
The PRTG core server is the heart of PRTG and it performs the following tasks:
In a cluster, the master node is responsible for all of these tasks.
The built-in, fast, and secure web server (no additional Microsoft Internet Information Services (IIS) or Apache is required) supports HTTP as well as secure HTTPS (via Secure Sockets Layer (SSL)). It serves the PRTG web interface when you access it via a browser and also answers PRTG API calls (for example, for user scripts).
PRTG core server and probes are configured as Windows services that are permanently run by the Windows system without the requirement for a logged-in user.
Probes
On the probe, PRTG performs the actual monitoring via the sensors created on a device (for example, computer, router, server, or firewall). The probe receives its configuration from the PRTG core server, runs the monitoring processes, and delivers monitoring results back to the PRTG core server.
For PRTG on premises, there is always the local probe that runs on the same machine as the PRTG core server.
For PRTG hosted by Paessler instances, there is always the hosted probe that runs on the PRTG core server system that we host for you.
The actual monitoring is performed by probe processes that run on one or more computers.
PRTG core servers and probes are configured as Windows services that are permanently run by the Windows system without the requirement for a logged-in user.
|
PROBE TYPE |
DESCRIPTION |
|---|---|
|
Local probe in PRTG on premises |
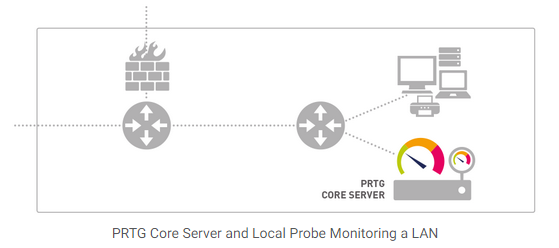
During the installation of PRTG on premises, the system automatically creates the local probe. In a single-probe installation—that is the default setup—the local probe performs all monitoring. For PRTG on premises, the PRTG core server with the local probe inside the corporate LAN can monitor services and servers in the entire LAN. For PRTG hosted by Paessler, you need at least one remote probe installation in your network for this purpose. |
|
Hosted probe in PRTG hosted by Paessler |
When creating a PRTG hosted by Paessler instance, the system automatically creates thehosted probe. The hosted probe shows monitoring values of the hosted instance and can monitor devices, servers, and services that are publicly available in the internet like, for example, websites. To monitor your LAN, you need at least one remote probe installation in your network. The local probe is not available in PRTG hosted by Paessler. |
|
Remote probes |
You can create additional remote probes to monitor multiple locations, for LAN monitoring with PRTG hosted by Paessler, or for several other scenarios. They use Transport Layer Security (TLS) secured connections to the PRTG core server and with them, you can securely monitor services and systems inside remote networks that are not openly available or are secured by firewalls. |
|
Cluster probes in PRTG on premises |
In a cluster, a cluster probe runs on all cluster nodes. All devices that you create on the cluster probe are monitored by all cluster nodes, so data from different perspectives is available and monitoring continues even if one of the cluster nodes fails. |
|
Mini probes in PRTG on premises |
Mini probes let you create small probes on any device (not just on Windows systems). You can implement mini probes to gather monitoring data exactly like you need it and you can create them on any platform. |
System Health Monitoring
PRTG automatically monitors the system health of the PRTG core server and of each probe to discover overloading situations that may distort monitoring results. To monitor the status of the probe system, PRTG automatically creates a few sensors. These include the Core Health and Probe Health, System Health, Cluster Health, disk free, and bandwidth sensors for all installed network cards, as well as a Common SaaS sensor that checks the availability of widely used software as a service (SaaS) providers.
We recommend that you keep these sensors, but you can optionally remove all of them except for the Health sensors. They measure various internal system parameters of the probe system hardware and the probe's internal processes and compute resulting values. Frequent or repeated values below 100% should be investigated. Check the channels of a particular sensor for details.